

Explore your fleet
The fleet has one door in the sidebar: Explore. It is an outline of every place you
can read, nested the way your own tree is nested, with each system on the place where it
sits and each component beneath its system. From any row you open a side panel, and from
the panel the detail view at the entity’s own address. The old /fleet, /locations,
/systems and /components addresses all land on Explore.
Explore
Section titled “Explore”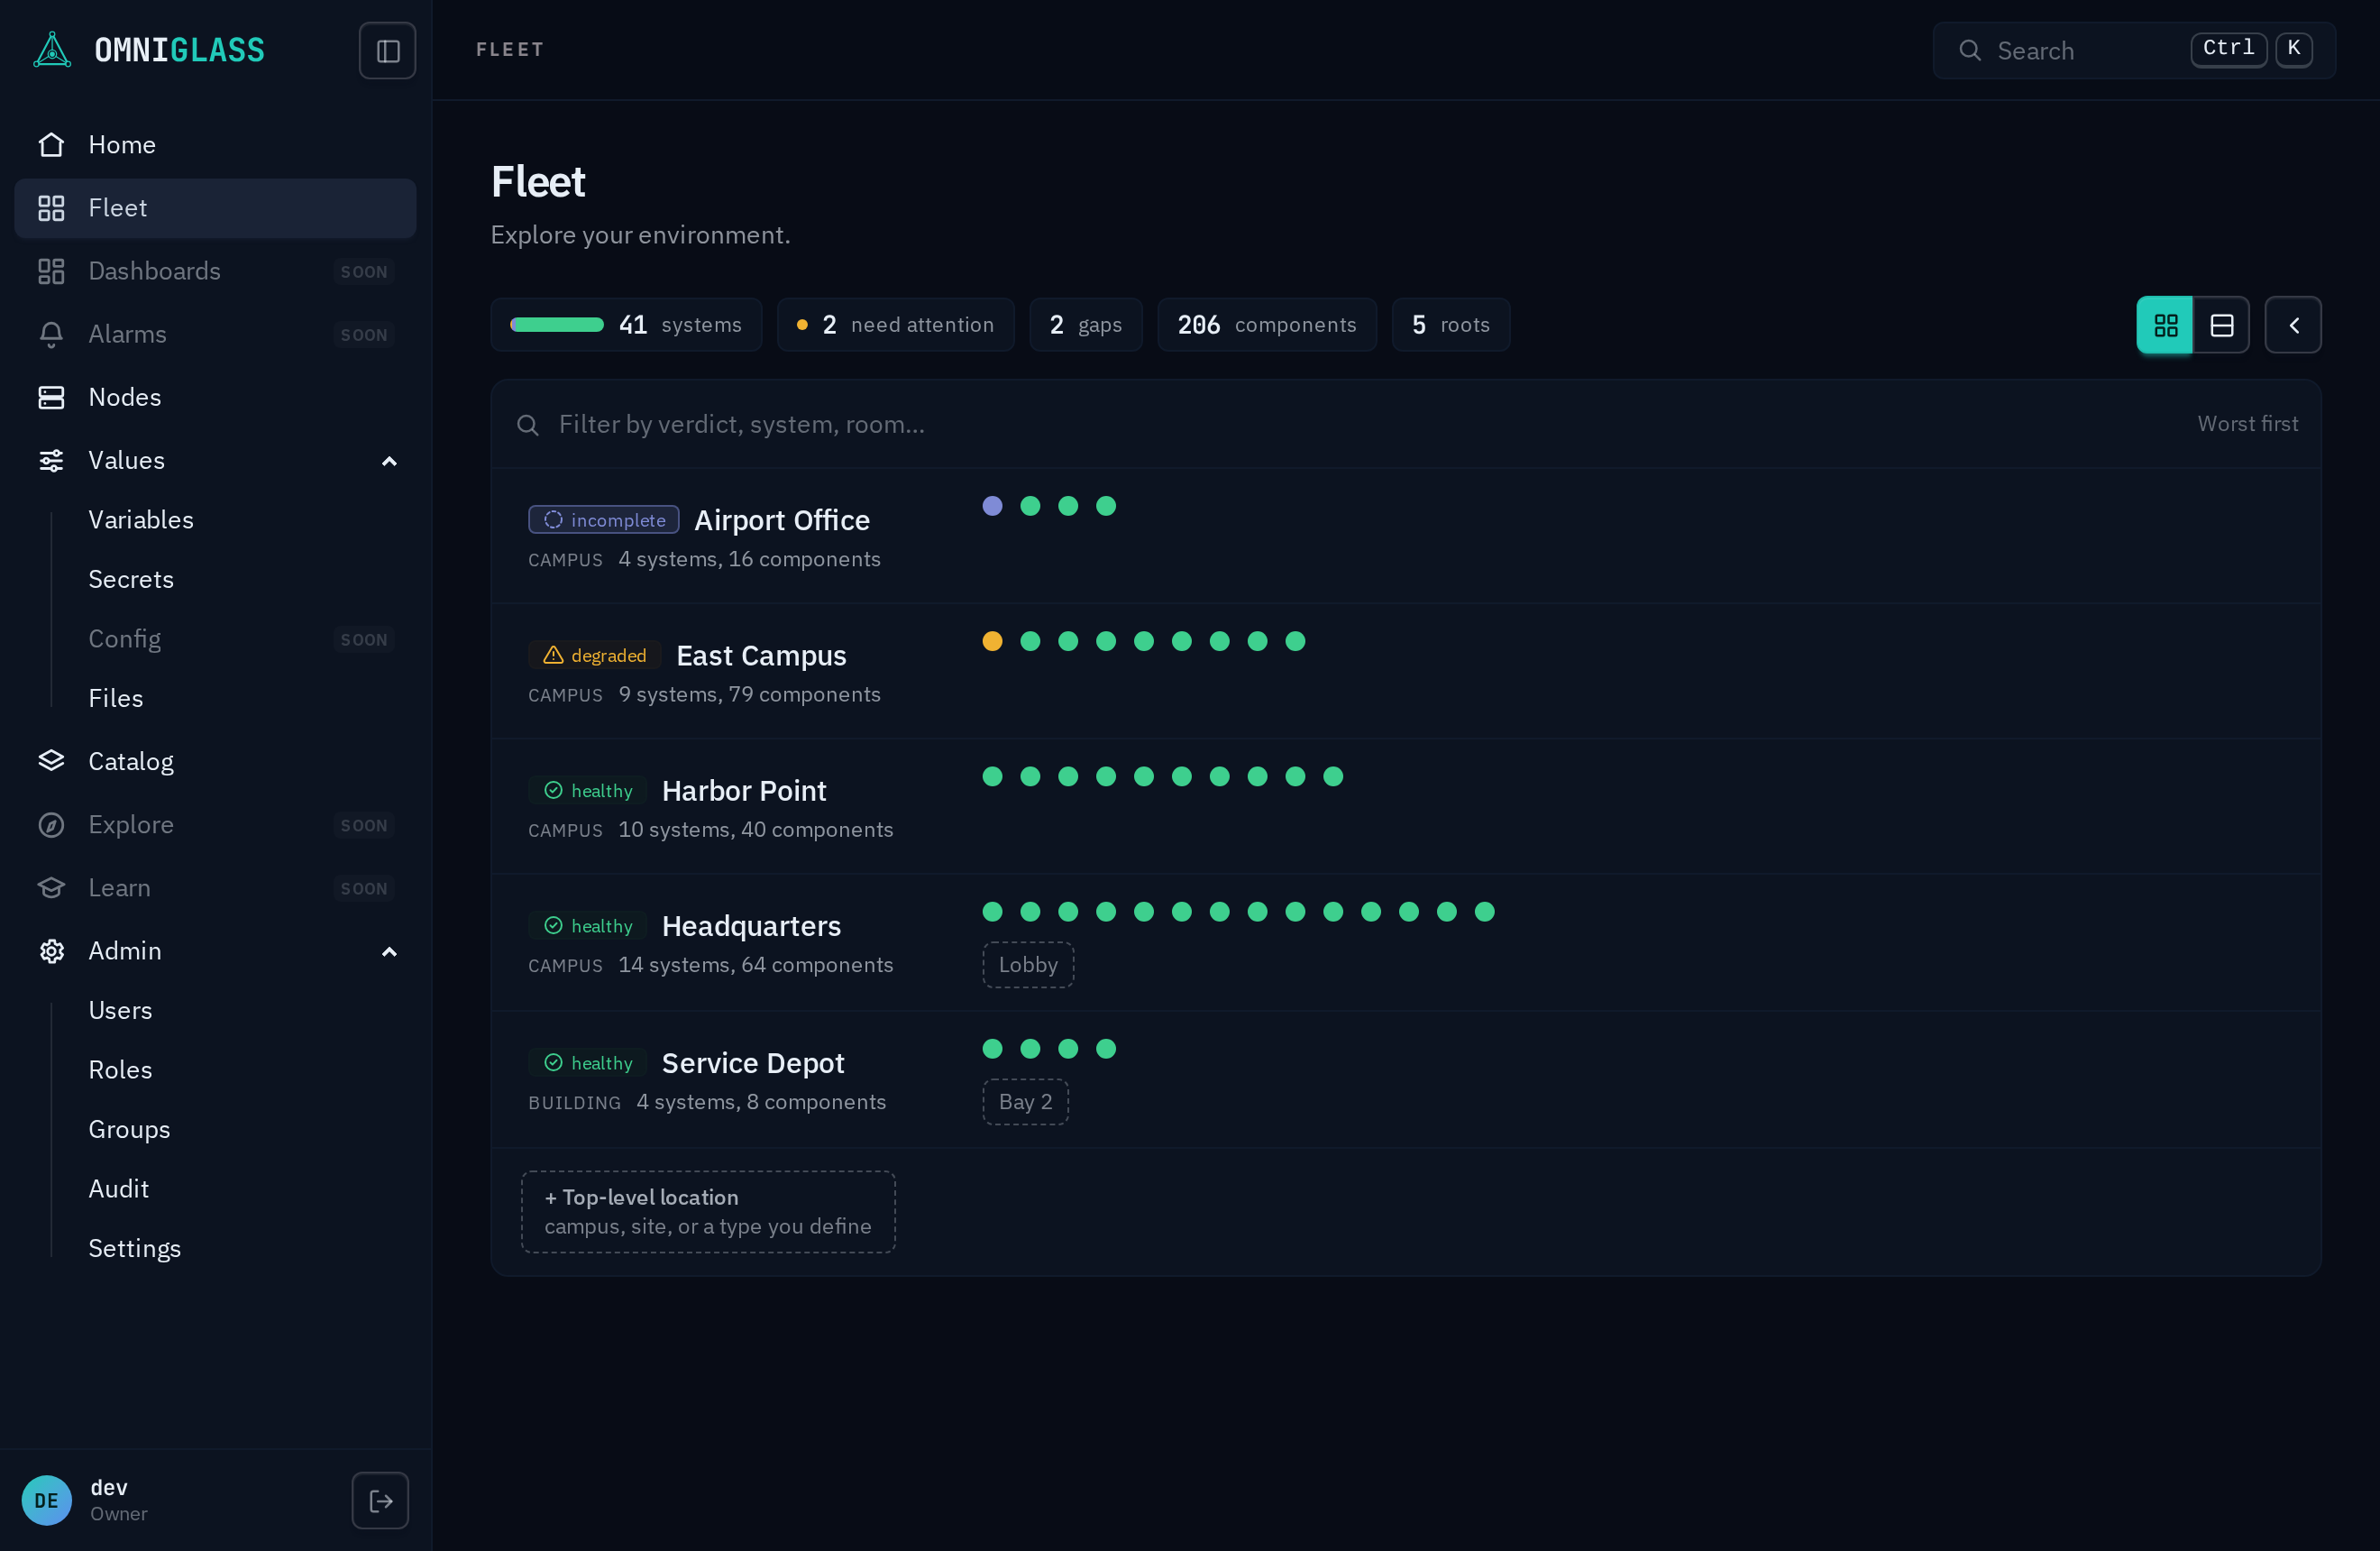
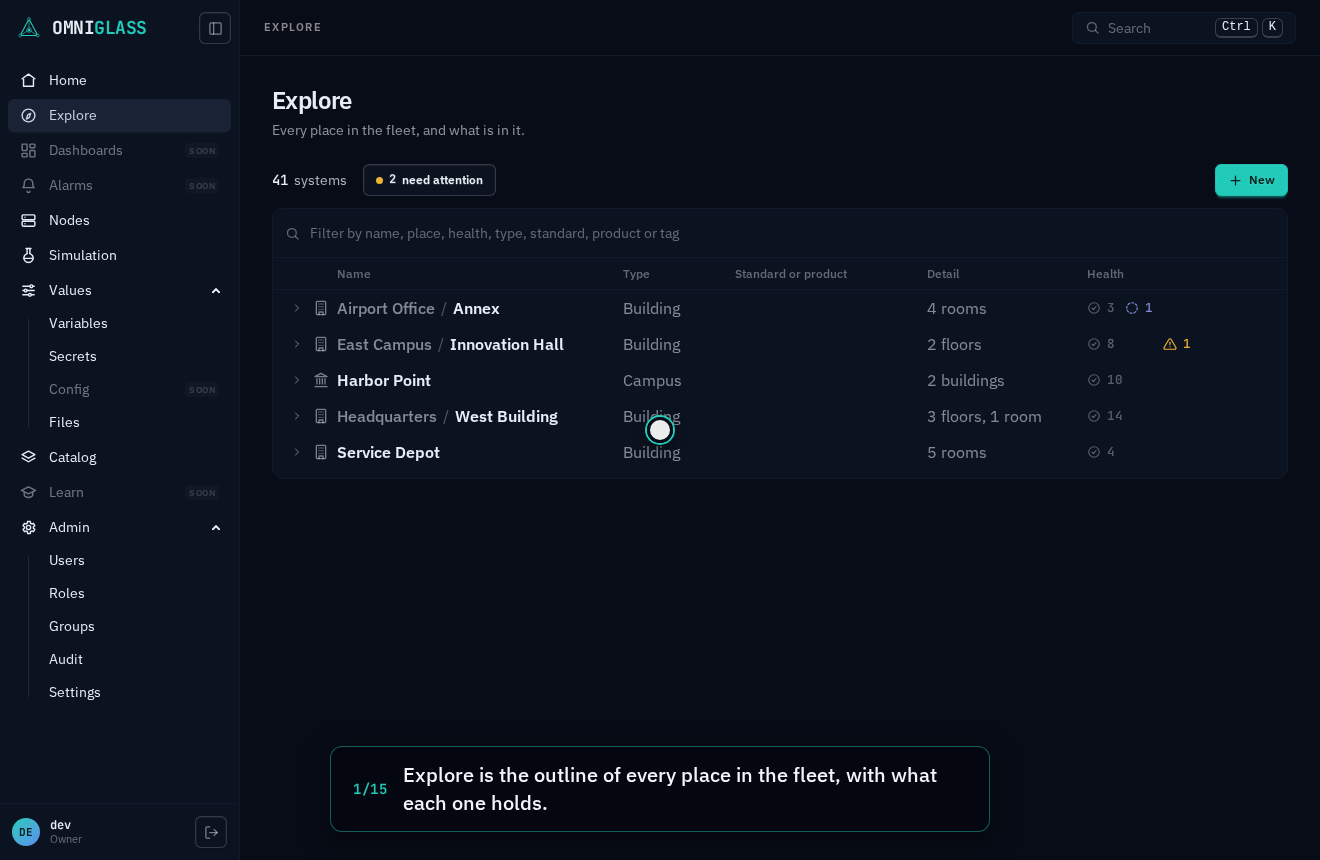
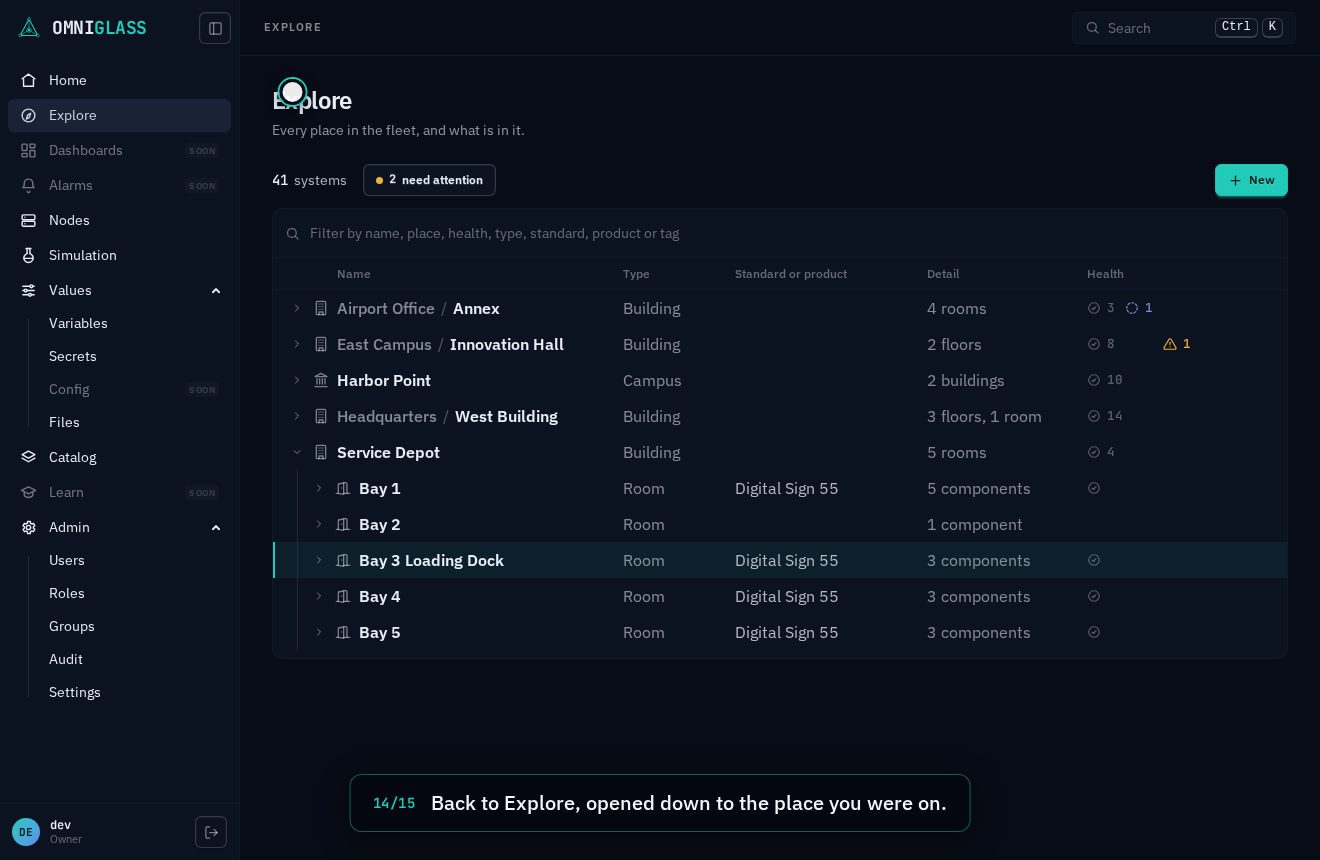
Explore opens with only the top-level places showing, every row collapsed, so the first screen is the whole fleet in a handful of lines. You open what you want to look into.
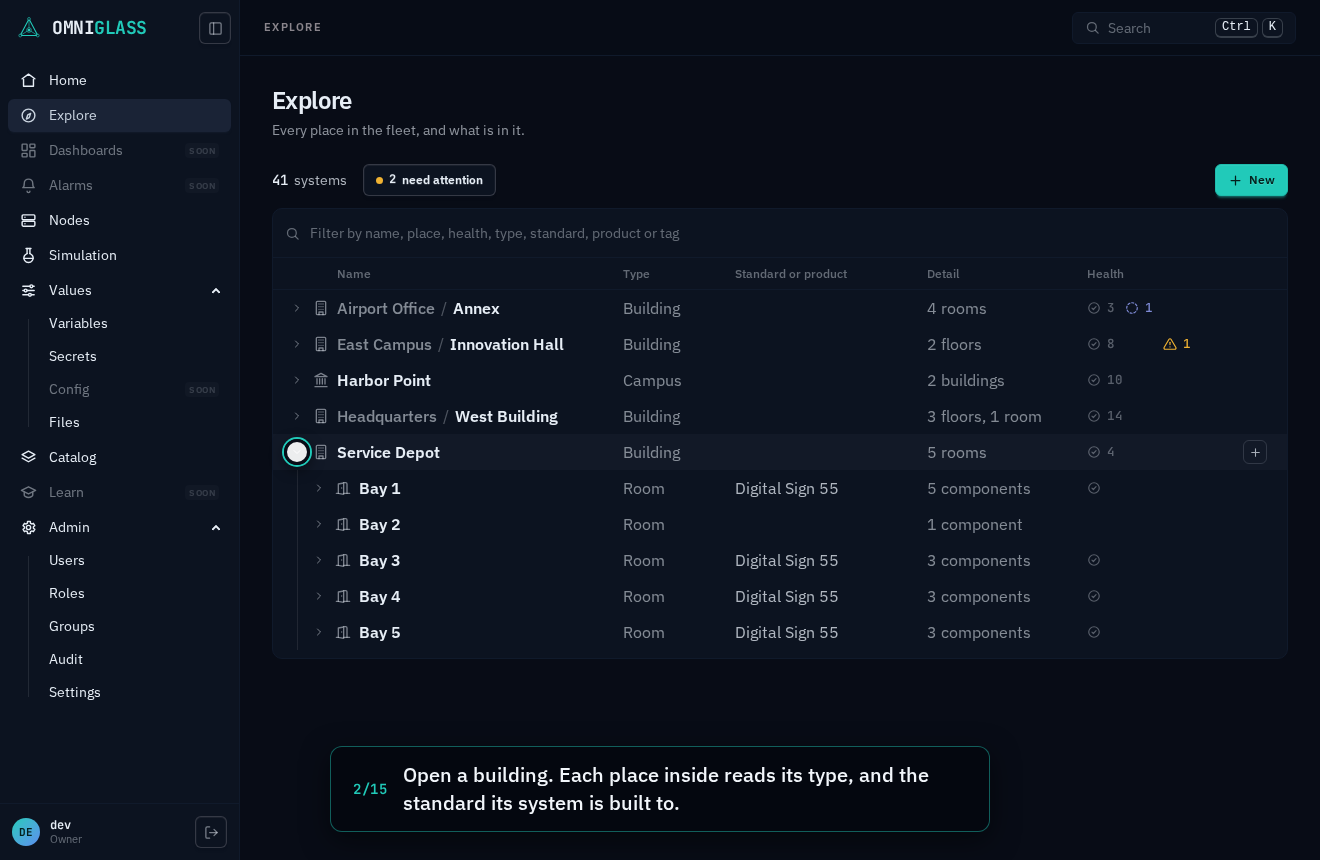
A place wears its system. An operator thinks of a room as its system, so a place where one system sits shows that system on its own row: the Standard column names the standard it conforms to, and Health its verdict. Open it and the system’s components are directly beneath, each with its product and health, and a component’s active alarm reads in the Detail column. A place holding two systems lists a row per system, with its components under each. A component two systems share appears under both, marked also in the other; a component in no system sits directly under its place.
A collapsed row says what it holds. The Detail column counts what is inside in your registry’s own words (2 buildings, 1 floor, 19 components, Empty), and the Health column counts the systems beneath it by verdict, in four fixed slots: healthy, incomplete, degraded, outage. Healthy is a muted green and each kind of trouble wears its full colour, so a red count stands out down the page without being read. The counts include everything beneath the row, so a collapsed branch cannot hide an outage. They are counts rather than one worst-case colour because at any real failure rate almost every large place holds one fault somewhere, and a worst-wins light would be red everywhere and say nothing.
A chain of one folds. A place whose only content is one child place folds into it: Headquarters / West Building is one row rather than two levels to click through. Its + offers each place it joins, so giving that campus a second building is the same click as giving the building a room.
None of this knows the shipped type names. Campus, building, floor and room are defaults, and a fleet of plots, sectors and coordinates, or any hierarchy your location types allow, nests, folds and counts by the same rules and is described in its own words.
Placed nowhere you can see collects what has no place on the page: a system at a location your grants do not reach, and a component created with no system and no place. Nothing disappears because its place is out of view.
Moving around
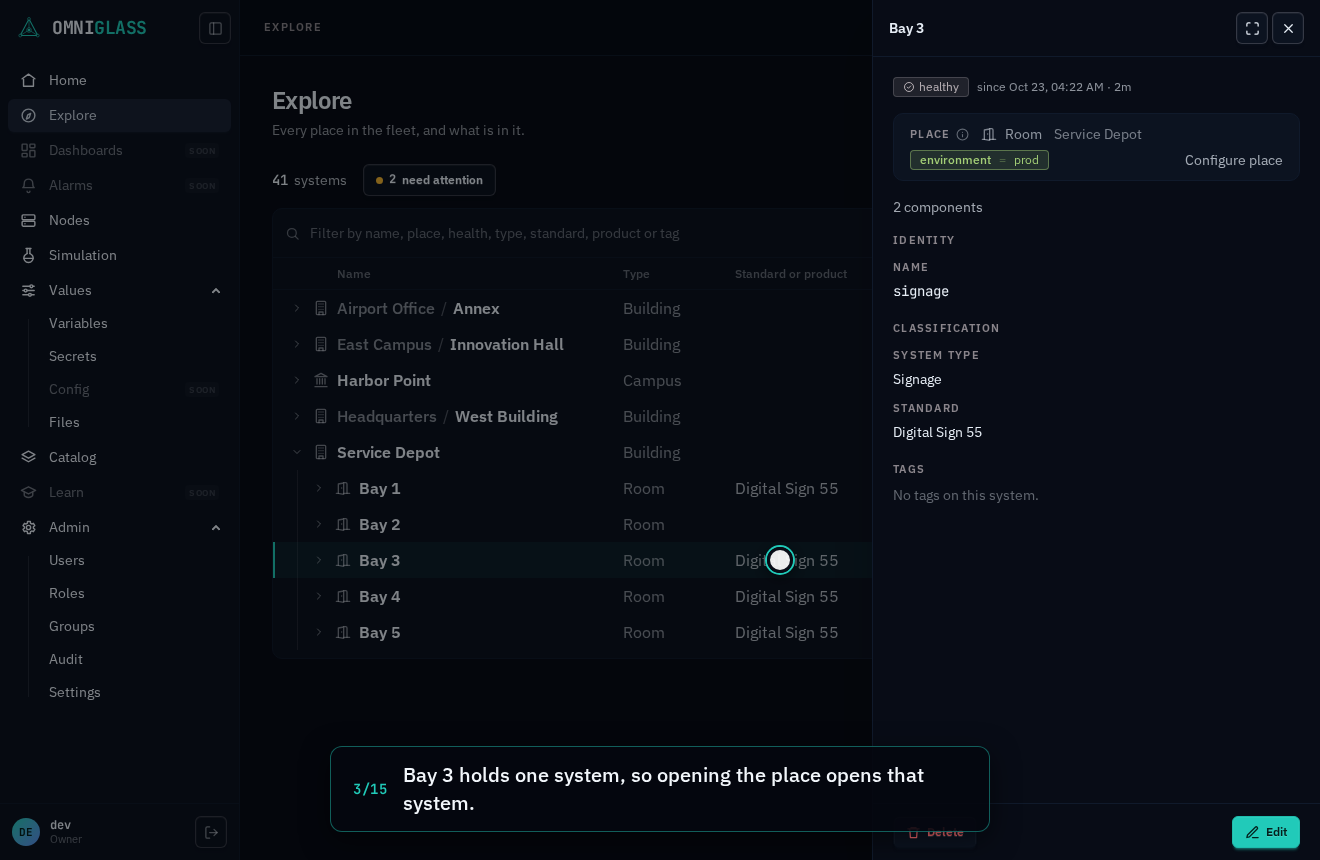
Section titled “Moving around”- A row’s chevron opens it, and Alt-click opens its whole branch. Clicking the row itself opens its side panel: a place holding one system opens that system, any other place the location, a component itself. The panel’s Expand opens the detail view.
- From the keyboard, the arrows move up and down, Right opens a row and Left closes it or
moves to its parent,
*opens the whole branch, Enter or Space opens the side panel, and+opens the row’s add menu. - What you have opened is remembered in this browser, so coming back lands where you left off.
- On a narrow window the columns give way in order, Standard or product, then Type, then Detail, so the name and its health always fit. A folded row’s outer path shortens before the place’s own name does, and at the narrowest it steps aside (hover the name for the whole path).
Finding one thing
Section titled “Finding one thing”The bar above the outline is a chip filter. Type a field name, then an operator, then a value; each commit becomes a chip.
- Within one chip, several values are OR (match any); across chips, the filters are AND (match all). Click a chip’s operator to cycle it, its value to re-edit it, and the x to remove it.
- A bare term matches a name, or any fragment of the path above it, so typing a building’s
name finds everything in that building.
verdict:,type:,standard:,product:andpath:narrow precisely. - Every tag in use is a field too: choose the tag’s key, then a value, to match its effective value (a component matches a tag it inherits from its system or location, not only one set on it directly). is set and is absent take no value and find the rows that carry the tag at all, or lack it.
While a filter is on, the outline becomes a flat list of matches, each with the path above it. Enter on a match shows it in the tree, opened down to it and selected, with the filter cleared; Space or a click opens its side panel. The counts line’s need attention is itself the filter: it keeps what is in outage, degraded or incomplete, and it is the same verdict chip the bar shows, so the two can never disagree.
What the filter bar does not offer is a location facet. Filtering on live state (a verdict, a standard, a type, a name) is exploring; naming the part of your fleet to include is choosing a scope, which is what a dashboard owns.
The address carries what you were looking at. ?chips= carries the filter, so a link hands
somebody exactly the matches you saw, and ?node= reveals one row: a location, system or
component by its id, or by a name that names exactly one thing, so ?node=huddle lands on
the huddle room, opened down to it and selected.
Create where you stand. A row’s +, or New above the outline, offers a location, a system or a component: the same create form, with the placement already filled in. It offers a location only where your location types let one sit, and only what you hold the create permission for.
Everything on the page is already filtered to your scope. Verdicts here are a glance; monitoring lives on the detail views and, later, the dashboards.
One view per system
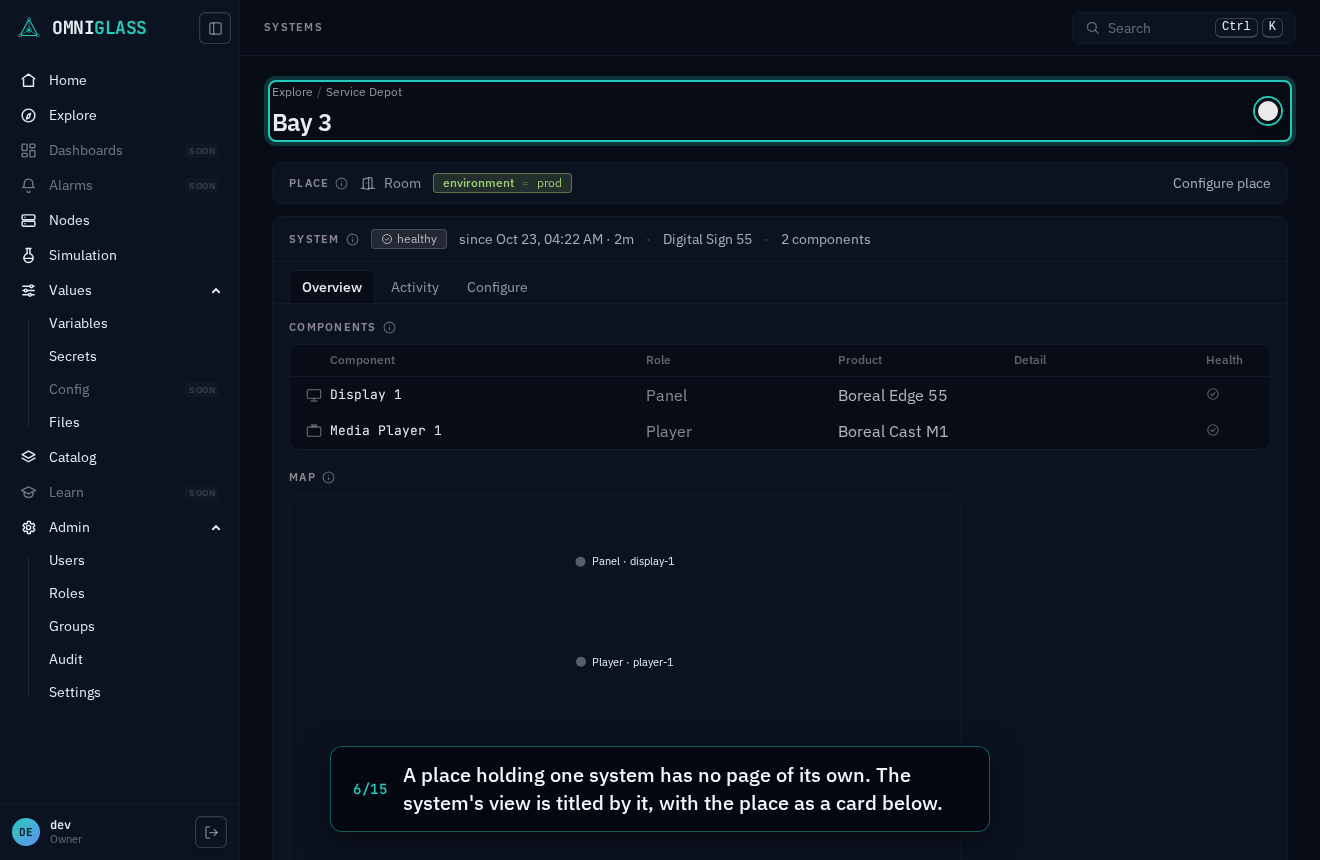
Section titled “One view per system”Omniglass monitors systems. A place is a folder and its facts; a component is a piece of a system. So the fleet has one detail view per system, and a room does not have a second, thinner view of its own: a place holding exactly one system (nearly every room) opens as that system. Its address lands there, and so does the panel’s Expand.
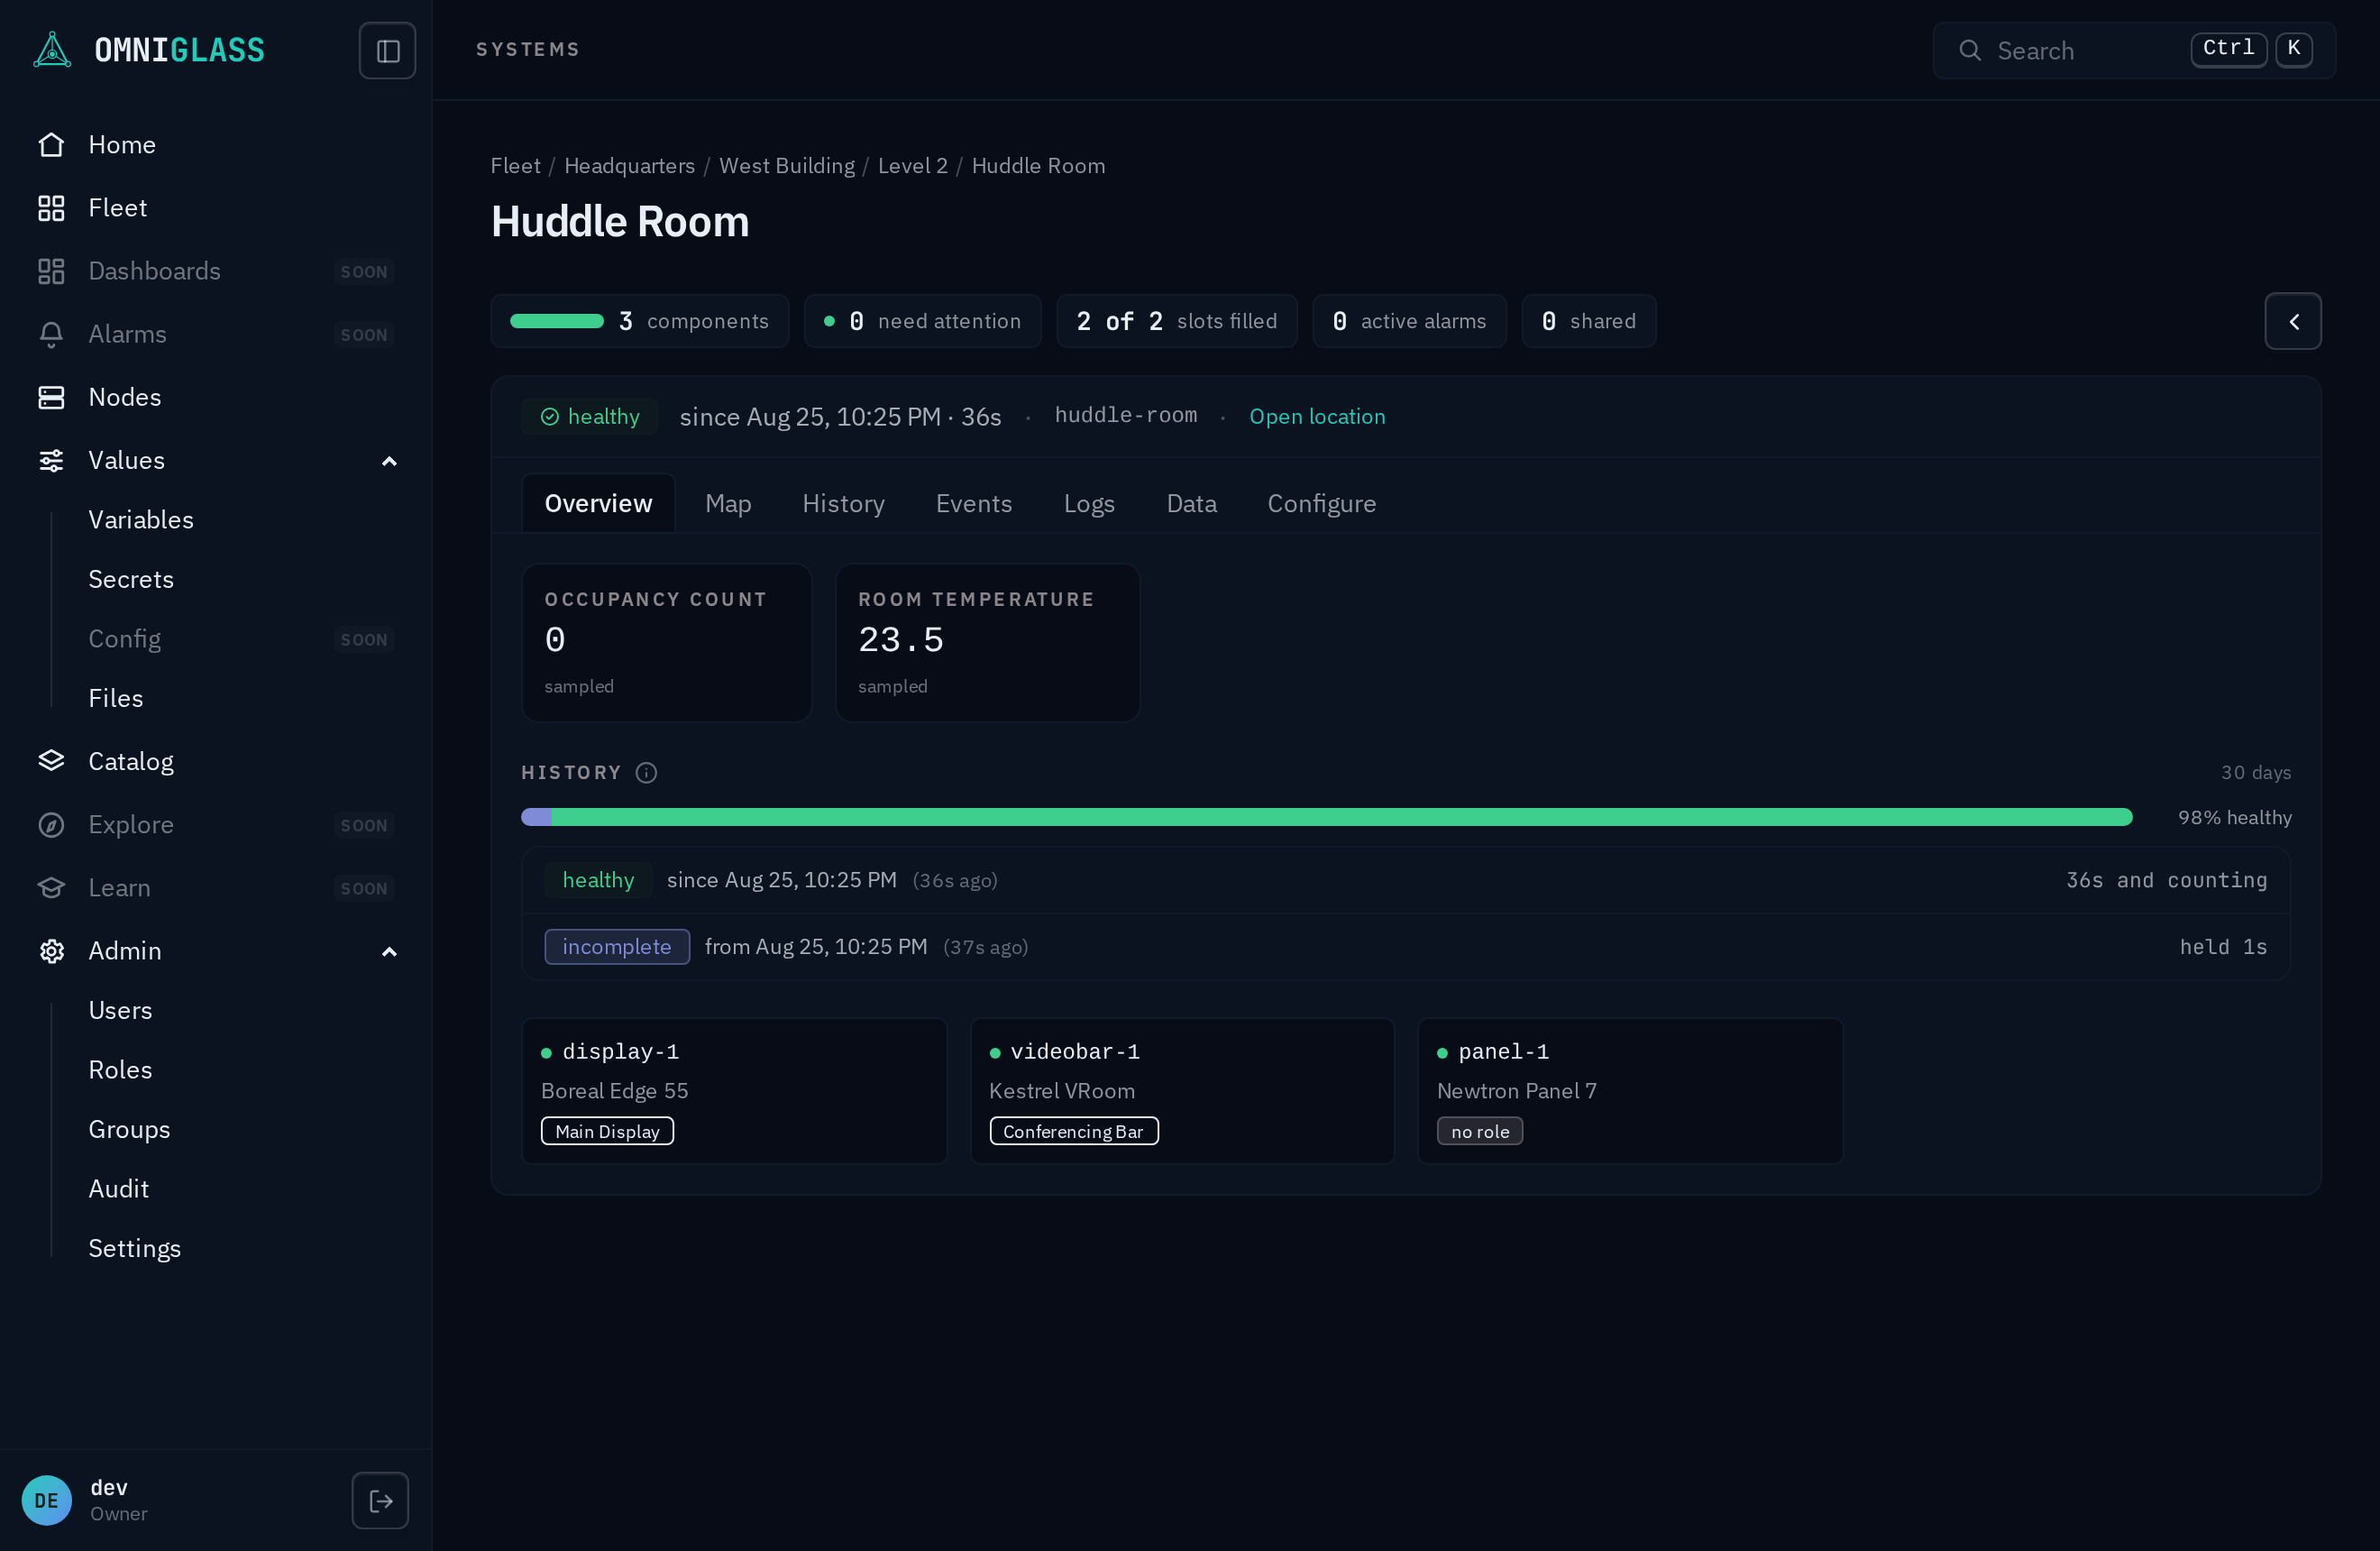
The view reads top-down:
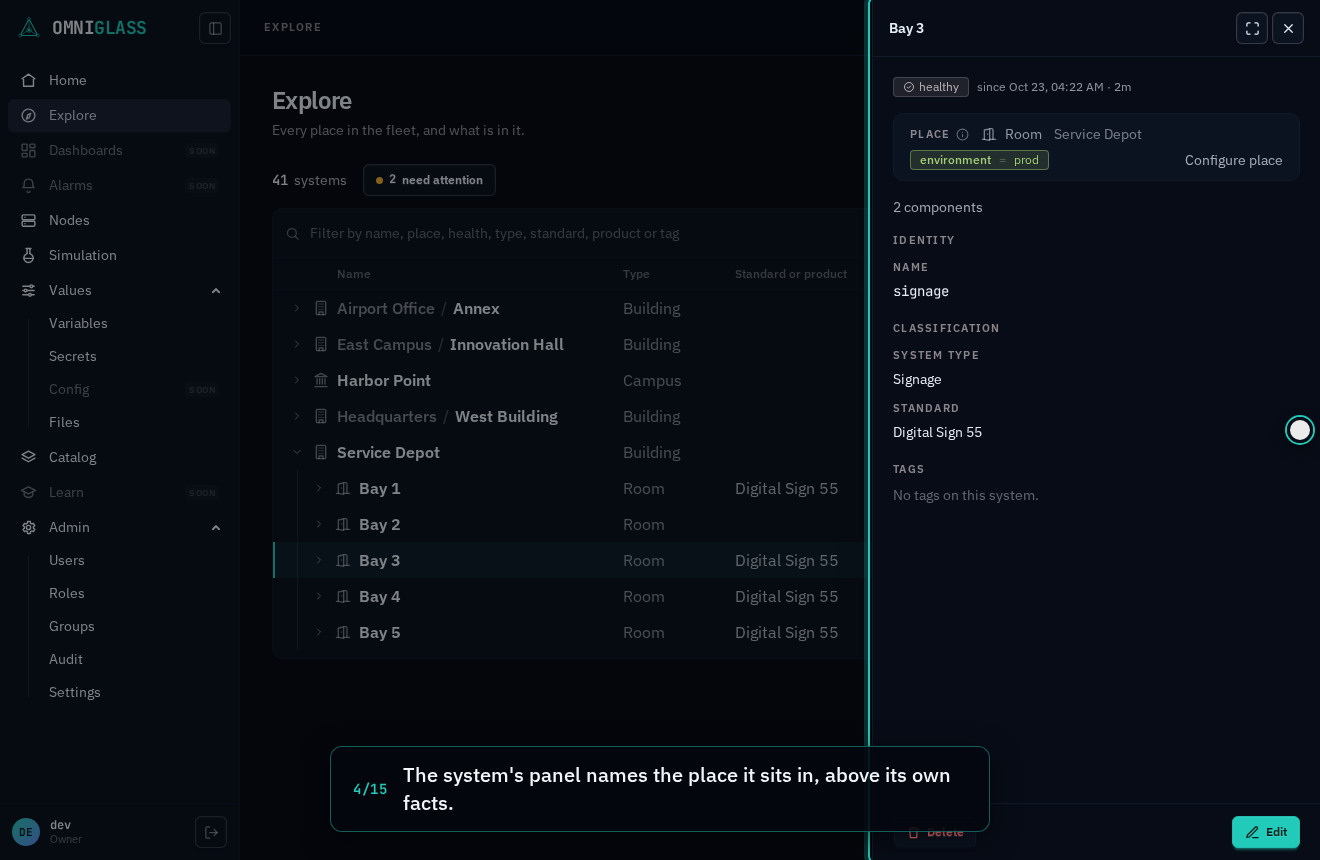
- The place card: where the system sits, as context. It names the place’s type in your registry’s words and its tags, and Place details opens the place’s own panel (its form, its Edit) without leaving the view. The view is titled by the place, so the card does not name it again, and the breadcrumb ends at the place’s parent: the room is named once. The breadcrumb’s Explore goes back up to where you were: the outline, opened down to this row and selected.
- The system card: the verdict and since when (the last recorded change and its age), the standard it is built to, how many components it holds, and slot arithmetic only while hardware is missing. Each fact is said once; there is no counts line above it.
- Three tabs. Overview is the system itself. Activity is what happened to it. Configure is the form that edits it in place.
A place holding a system and places beneath it lists those places under the system, as the outline rooted there.
The system’s view refreshes on its own while it is open, every 5 seconds: its verdict, Why, the roles and who is staffing them, each component’s health light, and the data section’s latest values (the 24 hour sparklines every 30), and on Activity the incidents, events and logs. A component going down shows up as the system’s new verdict and the alarm in Why without a reload, and every age on the page (since when, how long an alarm has been raised) keeps counting. It reads only this system and its members, never the whole fleet, and stops while the browser tab is hidden.
A system’s label is its place’s by default, so a room and its system read as one name. A place holding several systems names each one’s kind (“Media Lab Meeting Room”, “Media Lab Signage”), and a system with no place reads its kind. Type your own label and it stays yours.
A place’s own view
Section titled “A place’s own view”A place holding no system (a campus, a building, a floor) or more than one keeps a view of its own. Its card is the subject, with its own Overview and Configure tabs.
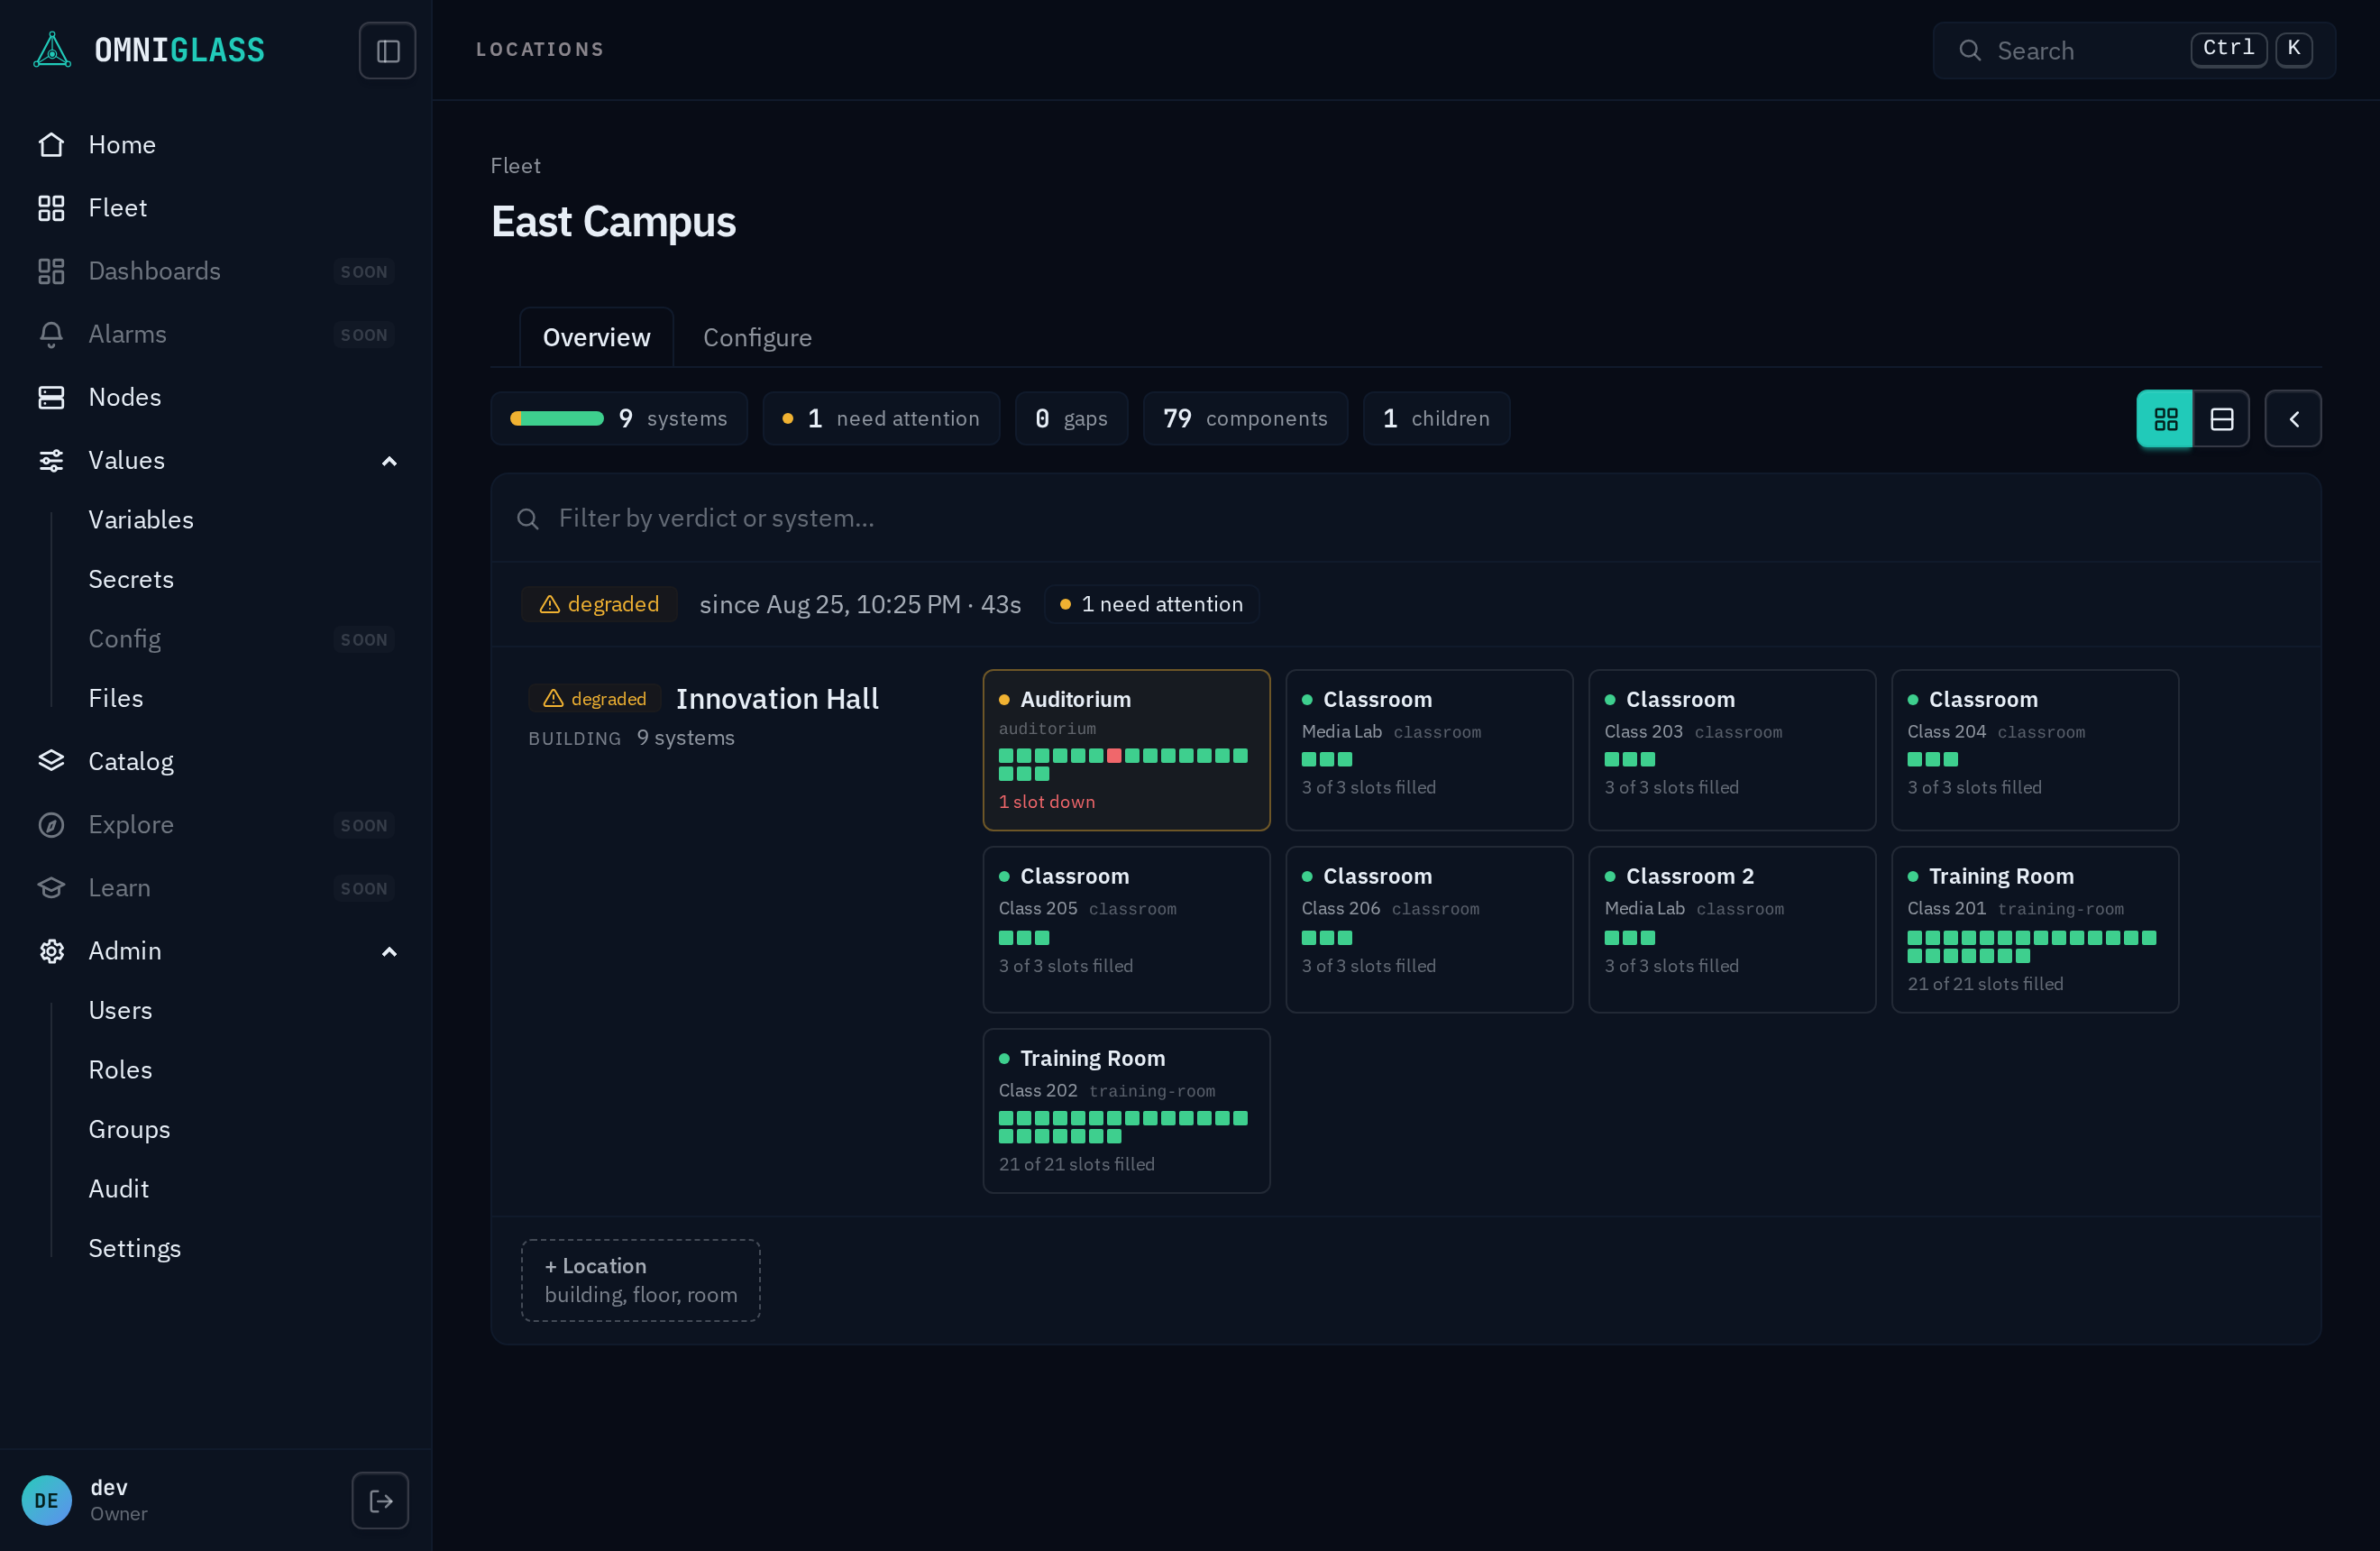
Overview lists what is beneath the place as the outline rooted there: the same columns, contents lines, health counts, chip filter, need attention and + as Explore, counted over this subtree. A place holding two or more systems shows a brief card per system first (verdict, since when, standard, size, why), each opening that system’s view.
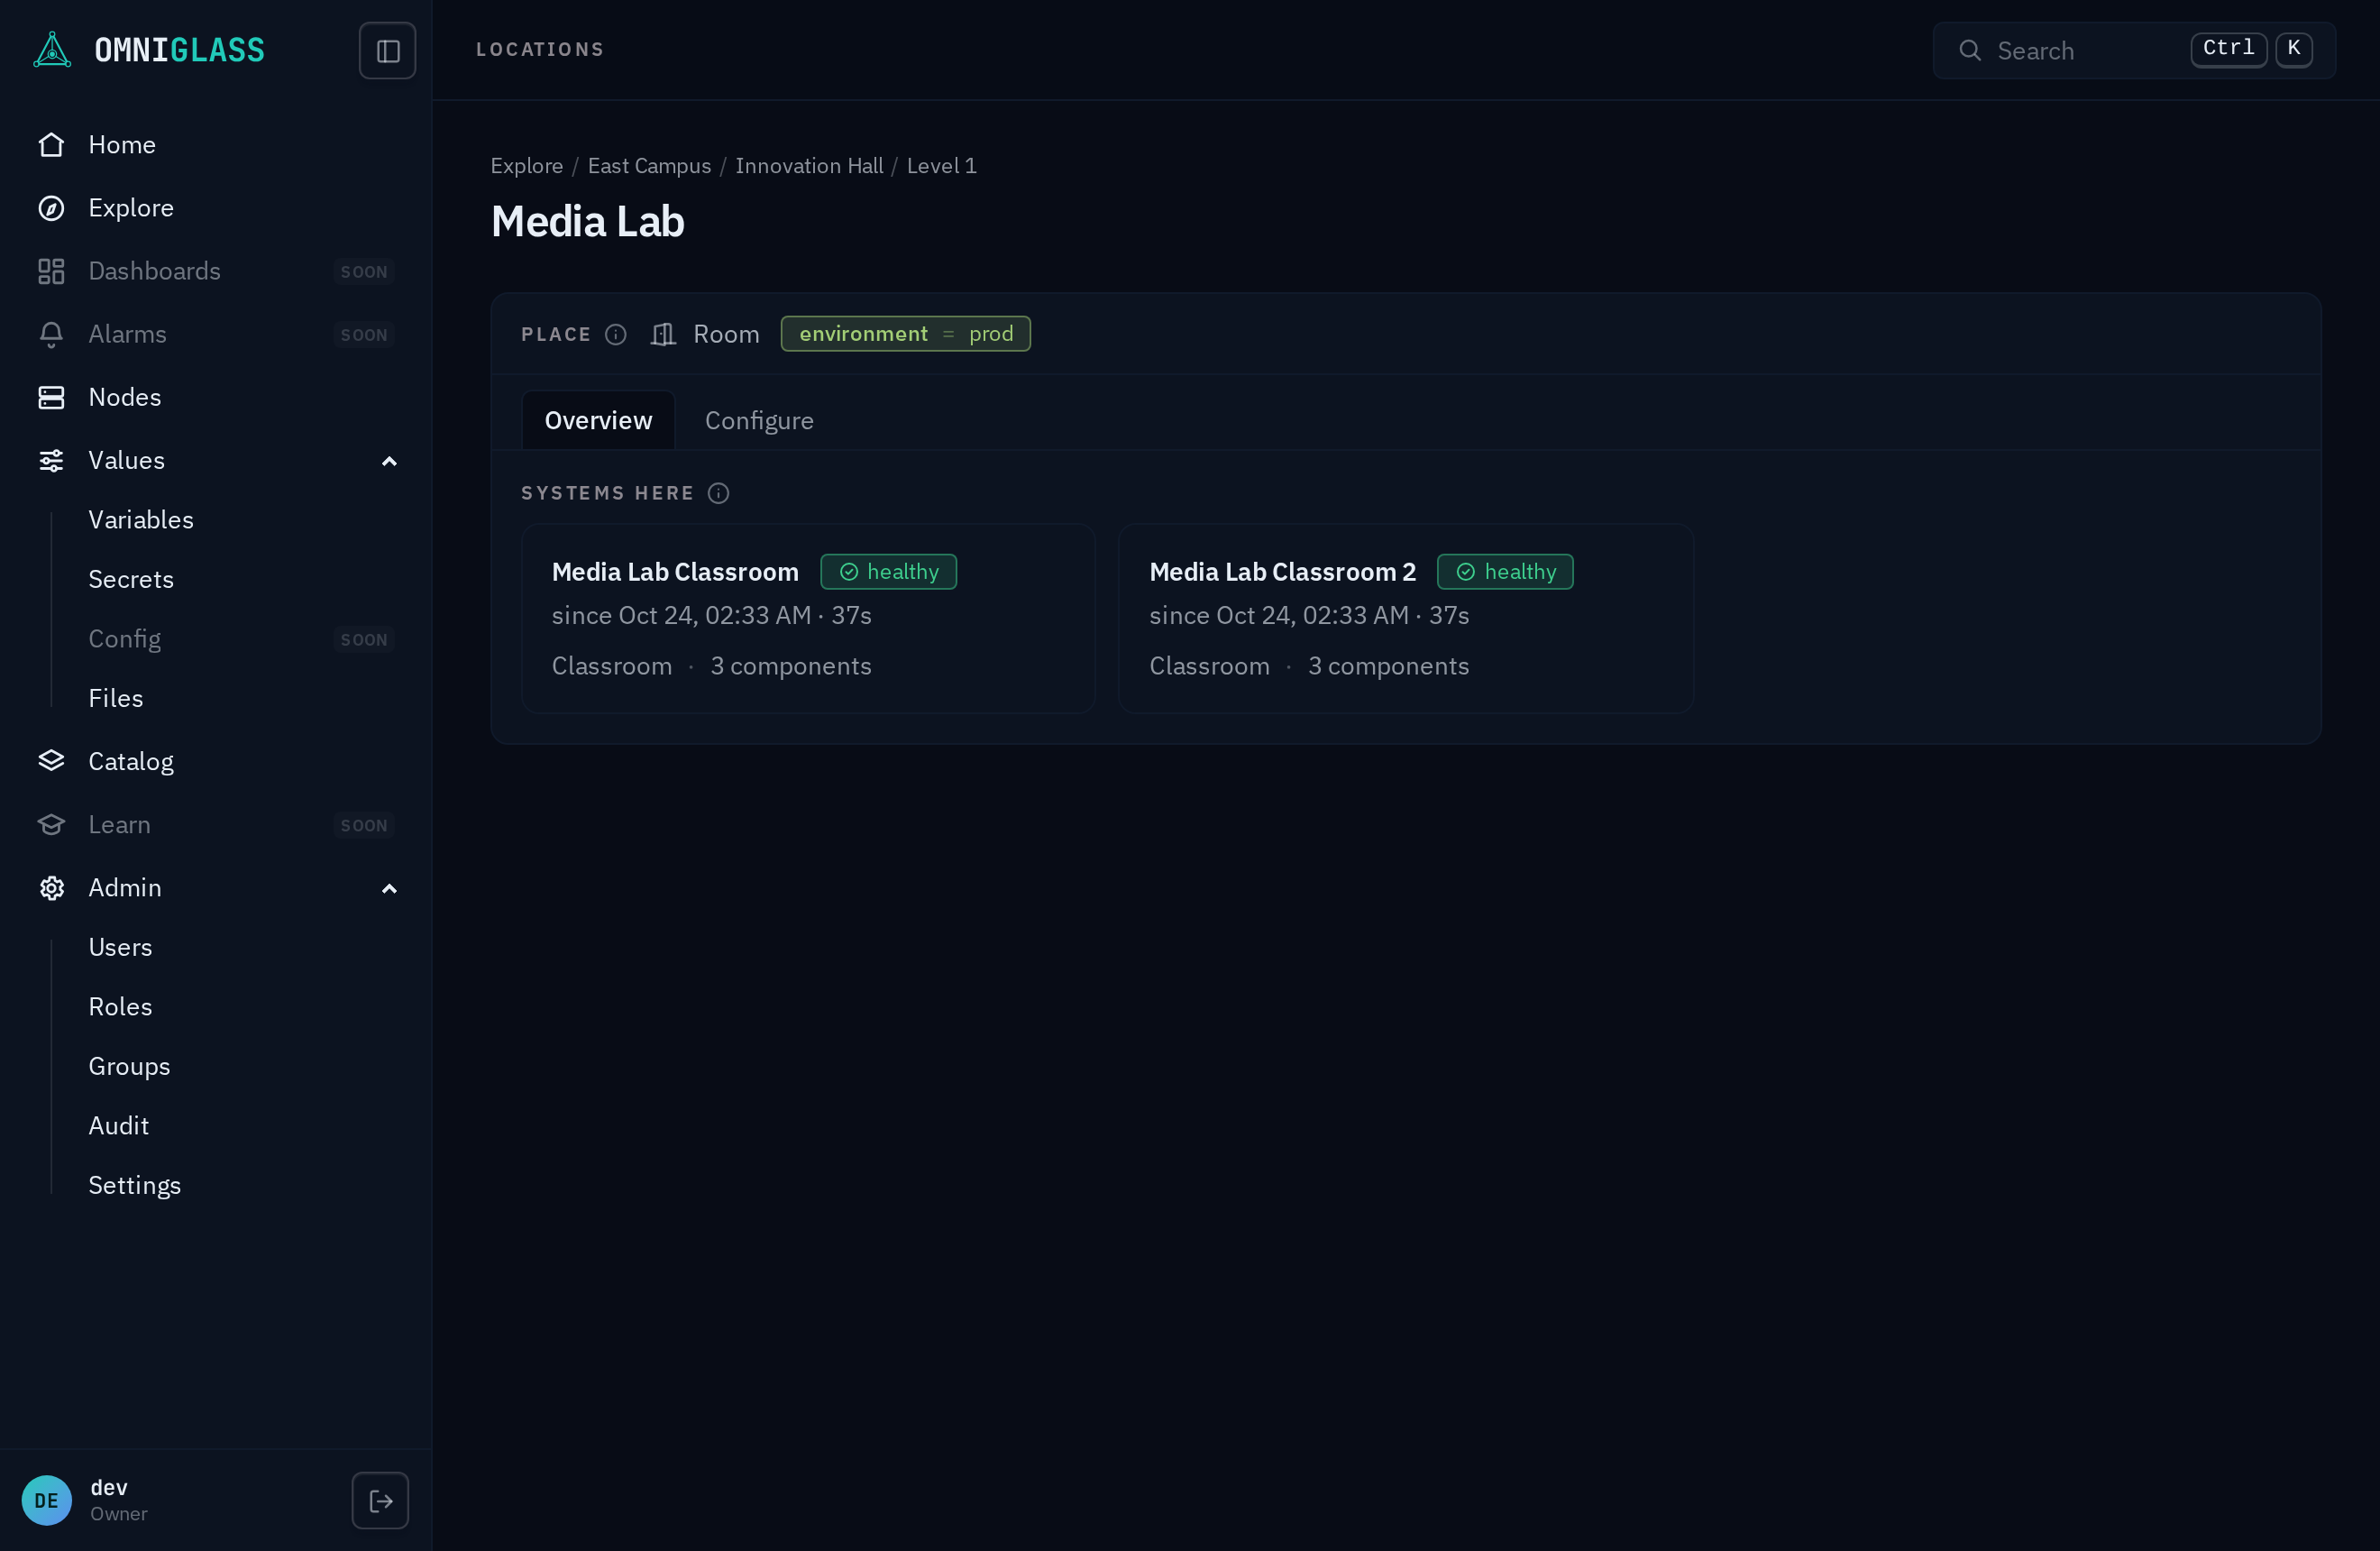
A place holding one system has no view of its own even to be configured: its place is
configured on the system’s Configure tab, in a Place section with its own Edit, so the
room is one page. An address asking to configure such a place lands there (?edit=1 on the
place becomes ?tab=configure&edit=place on its system).
Overview: why, then the components
Section titled “Overview: why, then the components”Cause before arithmetic:
- Why leads, worst first: severity, message, the down component (click it to open its panel), the role it impairs, and how long it has been raised.
- Components follow, as rows in the outline’s idiom: the component, the role it fills, its product, the alarm behind a red light, and its health (healthy a muted green, trouble in its own colour). Click a row to open its panel.
- Role chrome appears only where it says something a column cannot. A role that wants more than one occupant, is short, or is unstaffed heads a group with its arithmetic (“1 of 2, 1 spare”) and its occupants beneath; a seat nobody staffs draws as an empty slot. A down occupant still holds its seat: that is a failure the alarms explain, not a gap.
- A deployed system fills every role, so slot arithmetic appears only while hardware is missing. An unstaffed role reads incomplete (a commissioning gap); a short staffed role reads the impact it declared. Same arithmetic, different cause.
- The build a system did not choose never renders; choices are the standard editor’s vocabulary, not an operator’s.
- A shared component is marked also in the other system; a member filling no role reads no role, and that is a normal state.
Overview: the map and the data
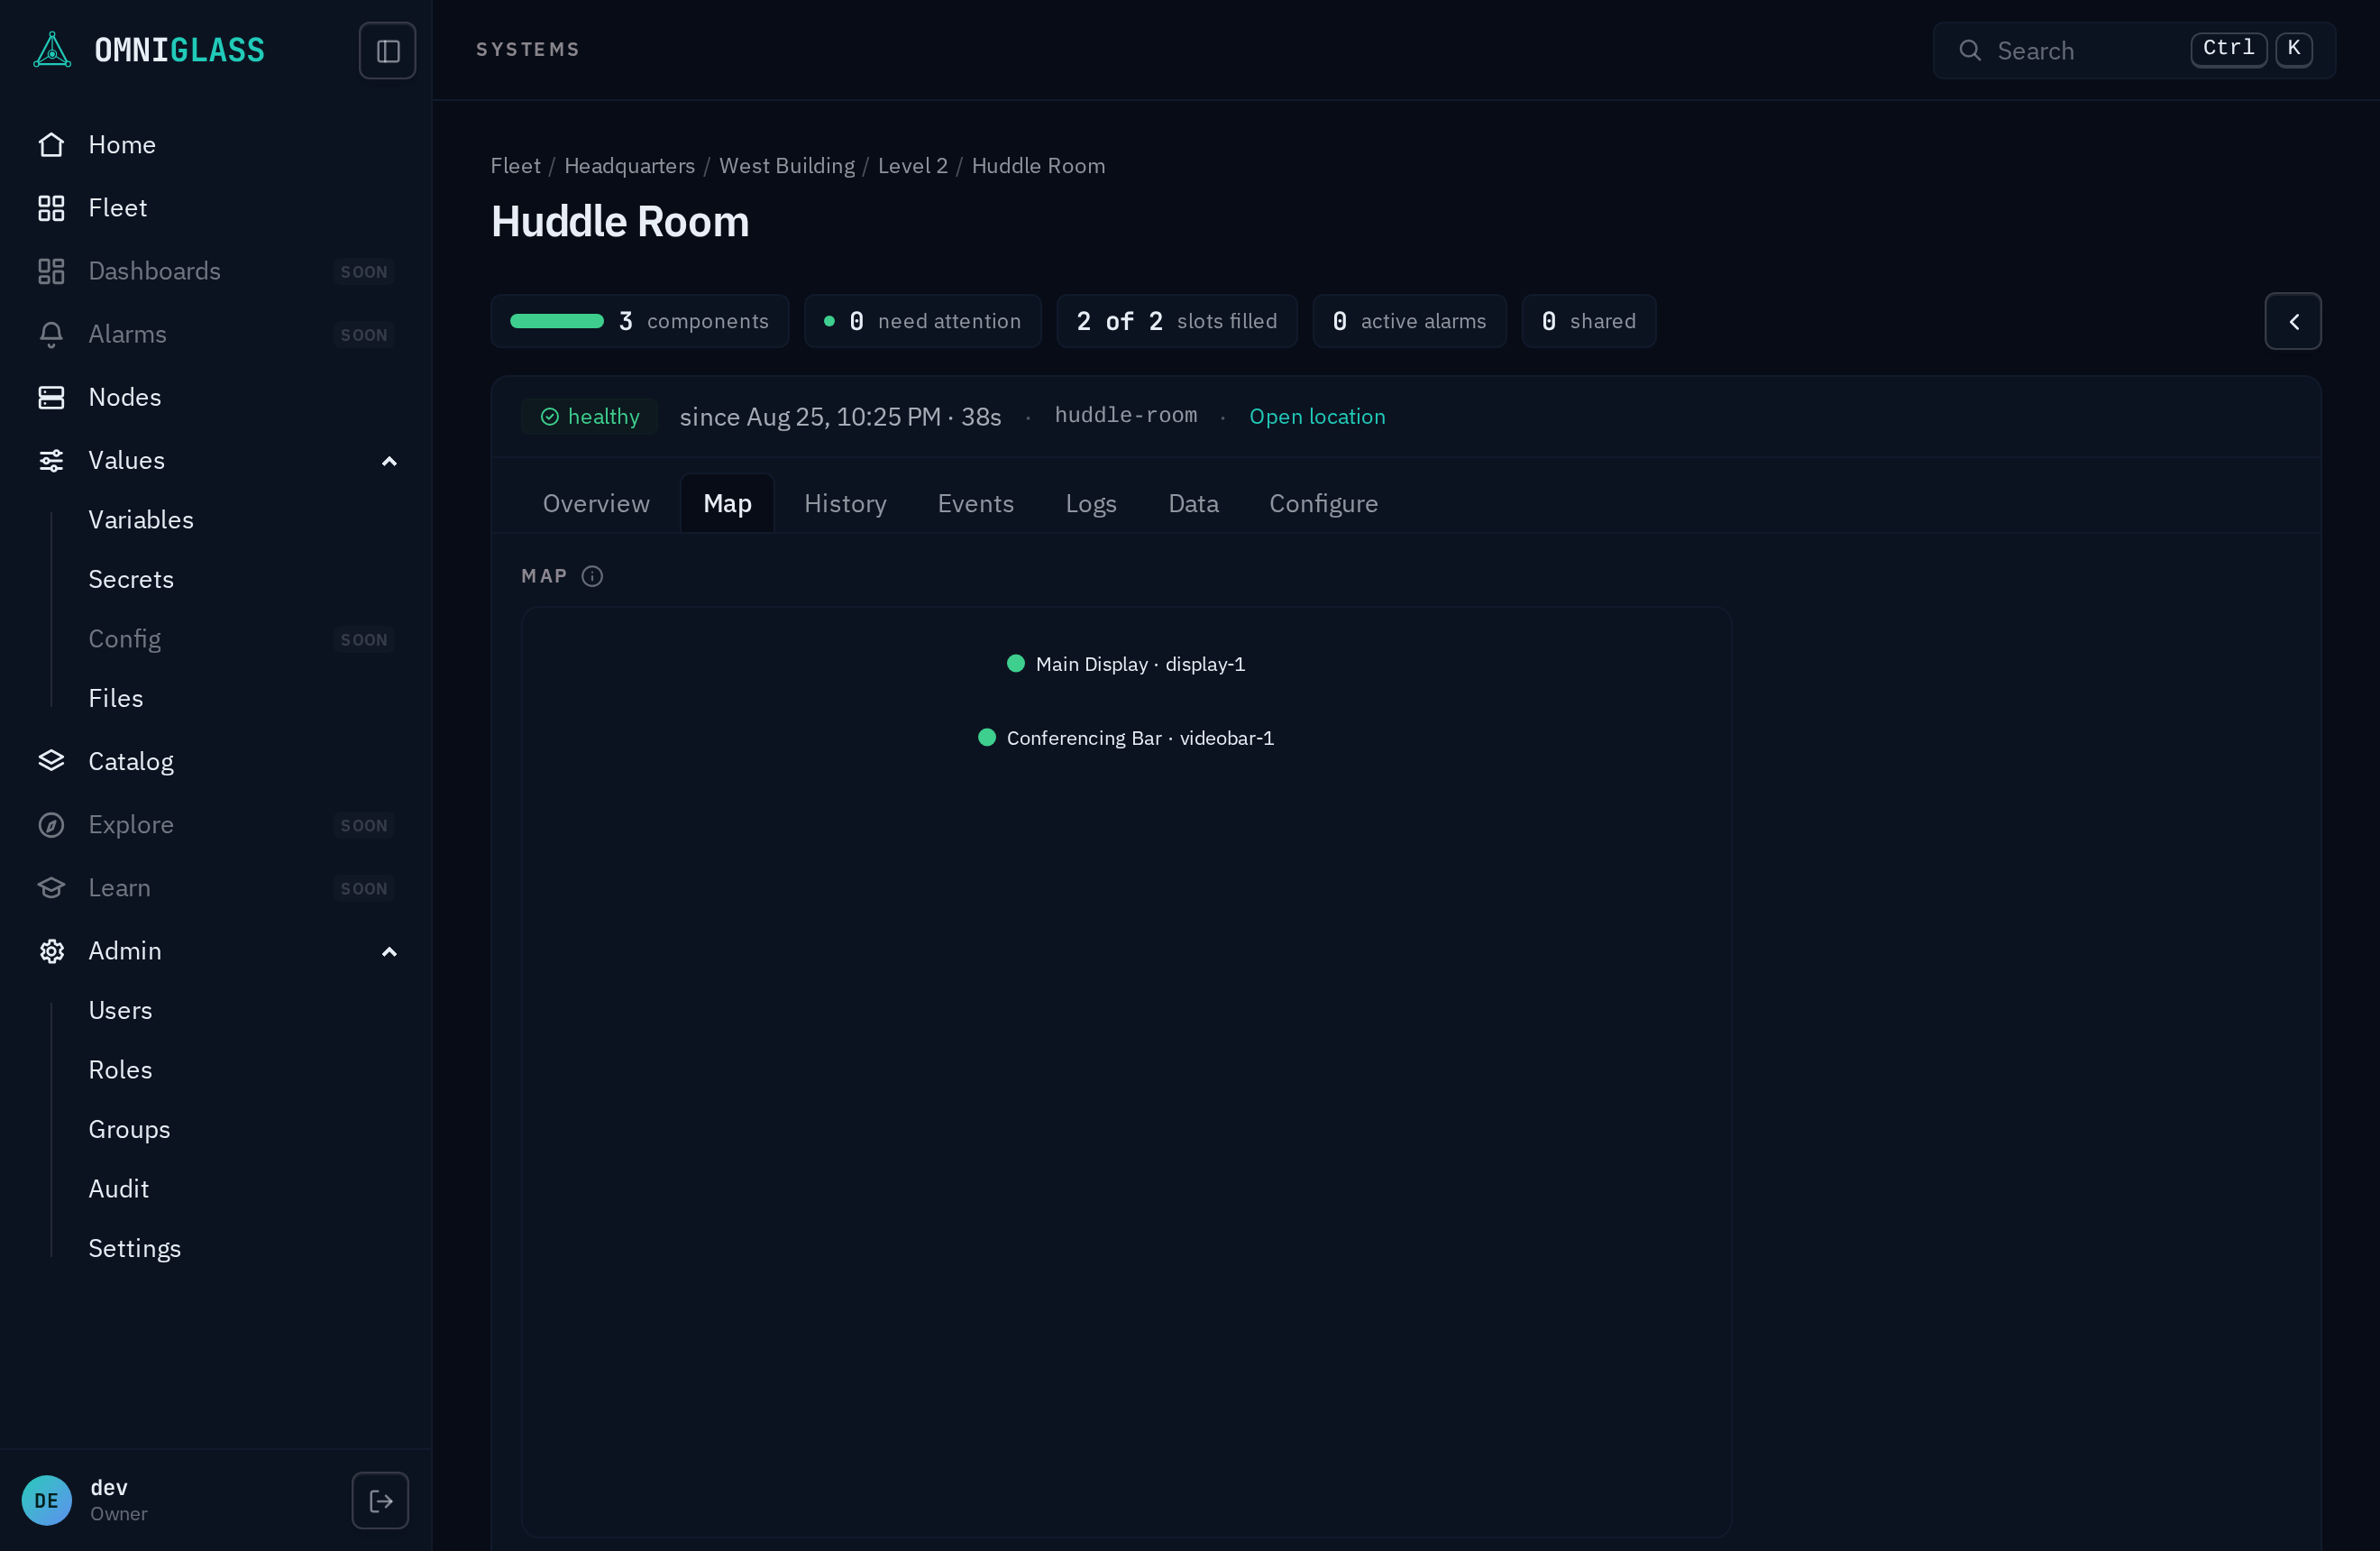
Section titled “Overview: the map and the data”A standard may declare the system’s physical layout (a room, a stage, a vehicle, whatever the system occupies): where each role position sits, top-down. Every system built to that standard draws the map inside Overview, under the components: one marker per declared position, solid in the occupant’s state (click it to open its panel), hollow where nobody is staffed. The label is the role, its position number when the role wants several, and the component holding it.
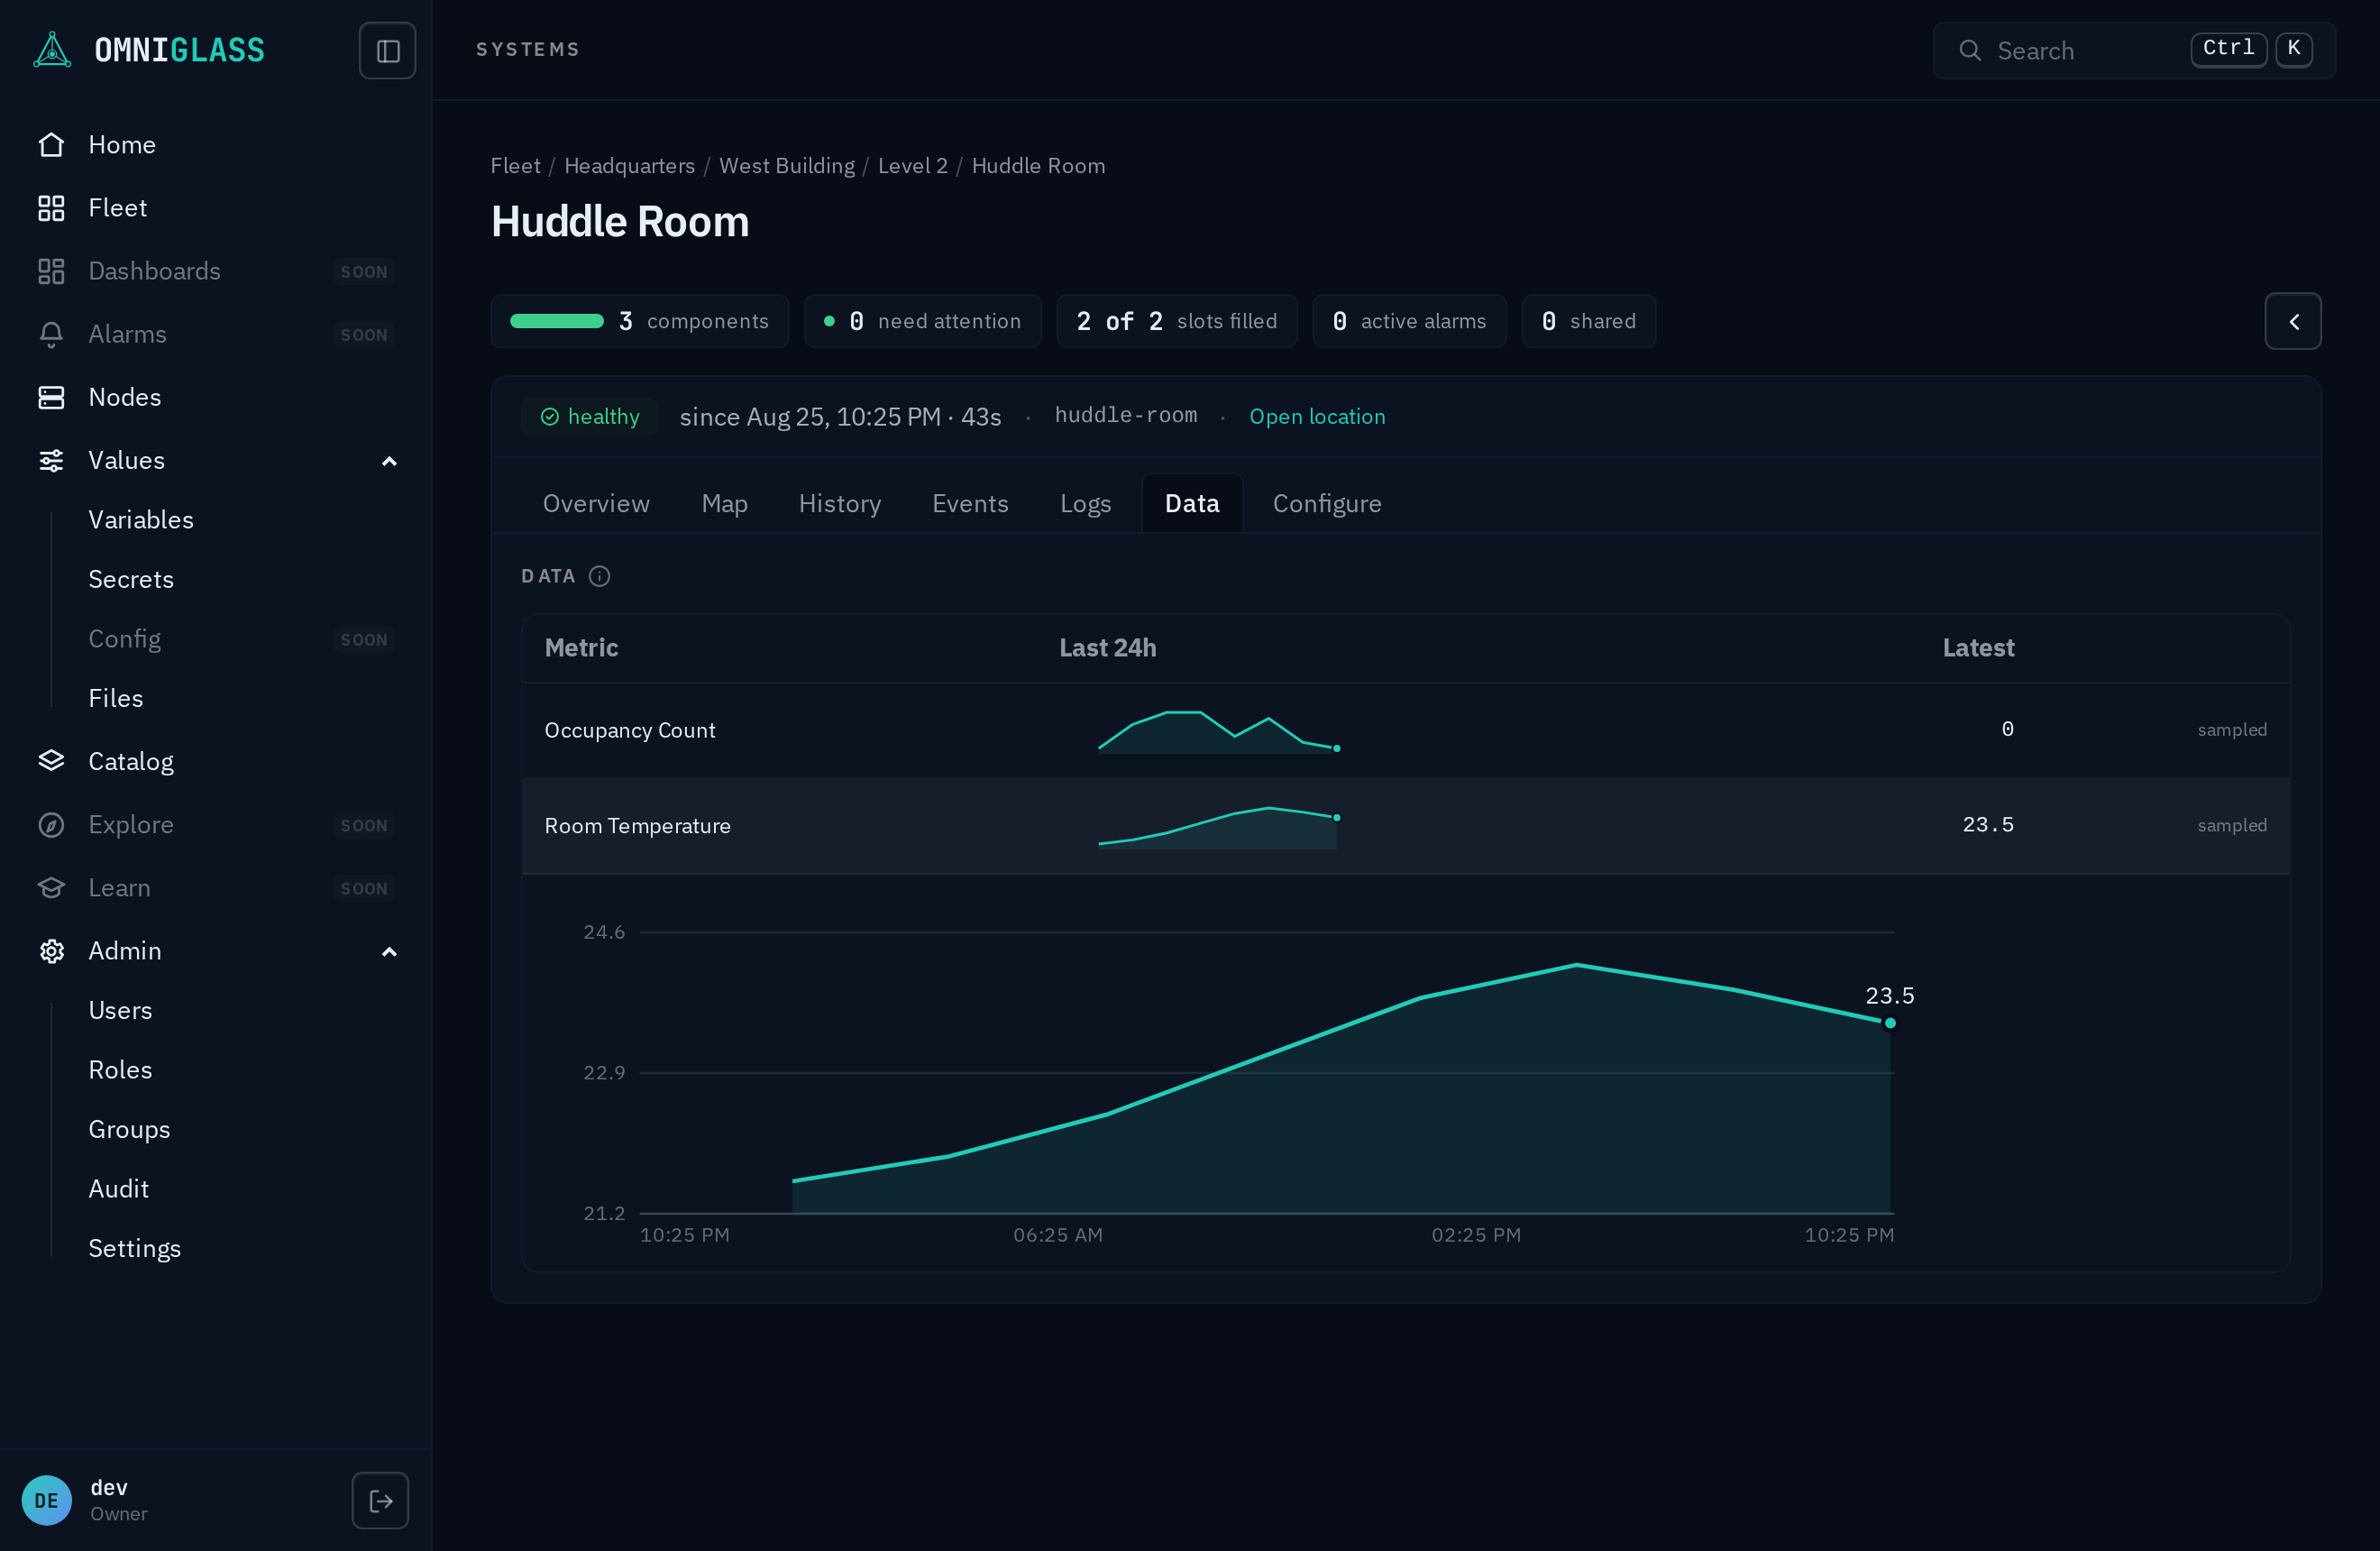
Below the map, when the standard declares metrics, the data section stacks every one of them, the only place a metric’s latest value is said: a sparkline of the last 24 hours beside the latest value, one row per series, so the system’s numbers read together. Click a row for the full chart, newest at the right, the latest sample’s value floating on its dot. Raw samples, capped; a series still on its contract default has nothing to chart yet, and says so.
Activity: the history, the events, the logs
Section titled “Activity: the history, the events, the logs”Activity reads the way a status page reads: the window’s uptime up top (the health KPI over time), the timeline beside it with one marker per alarm raise, then incidents: one entry per contiguous stretch away from healthy, ongoing first, each expanding to the verdict changes inside it and the alarms that explain them. An alarm the system absorbed without going unhealthy lists under other alarms. A system that flaps weekly and a system that failed once look different here, which is the point.
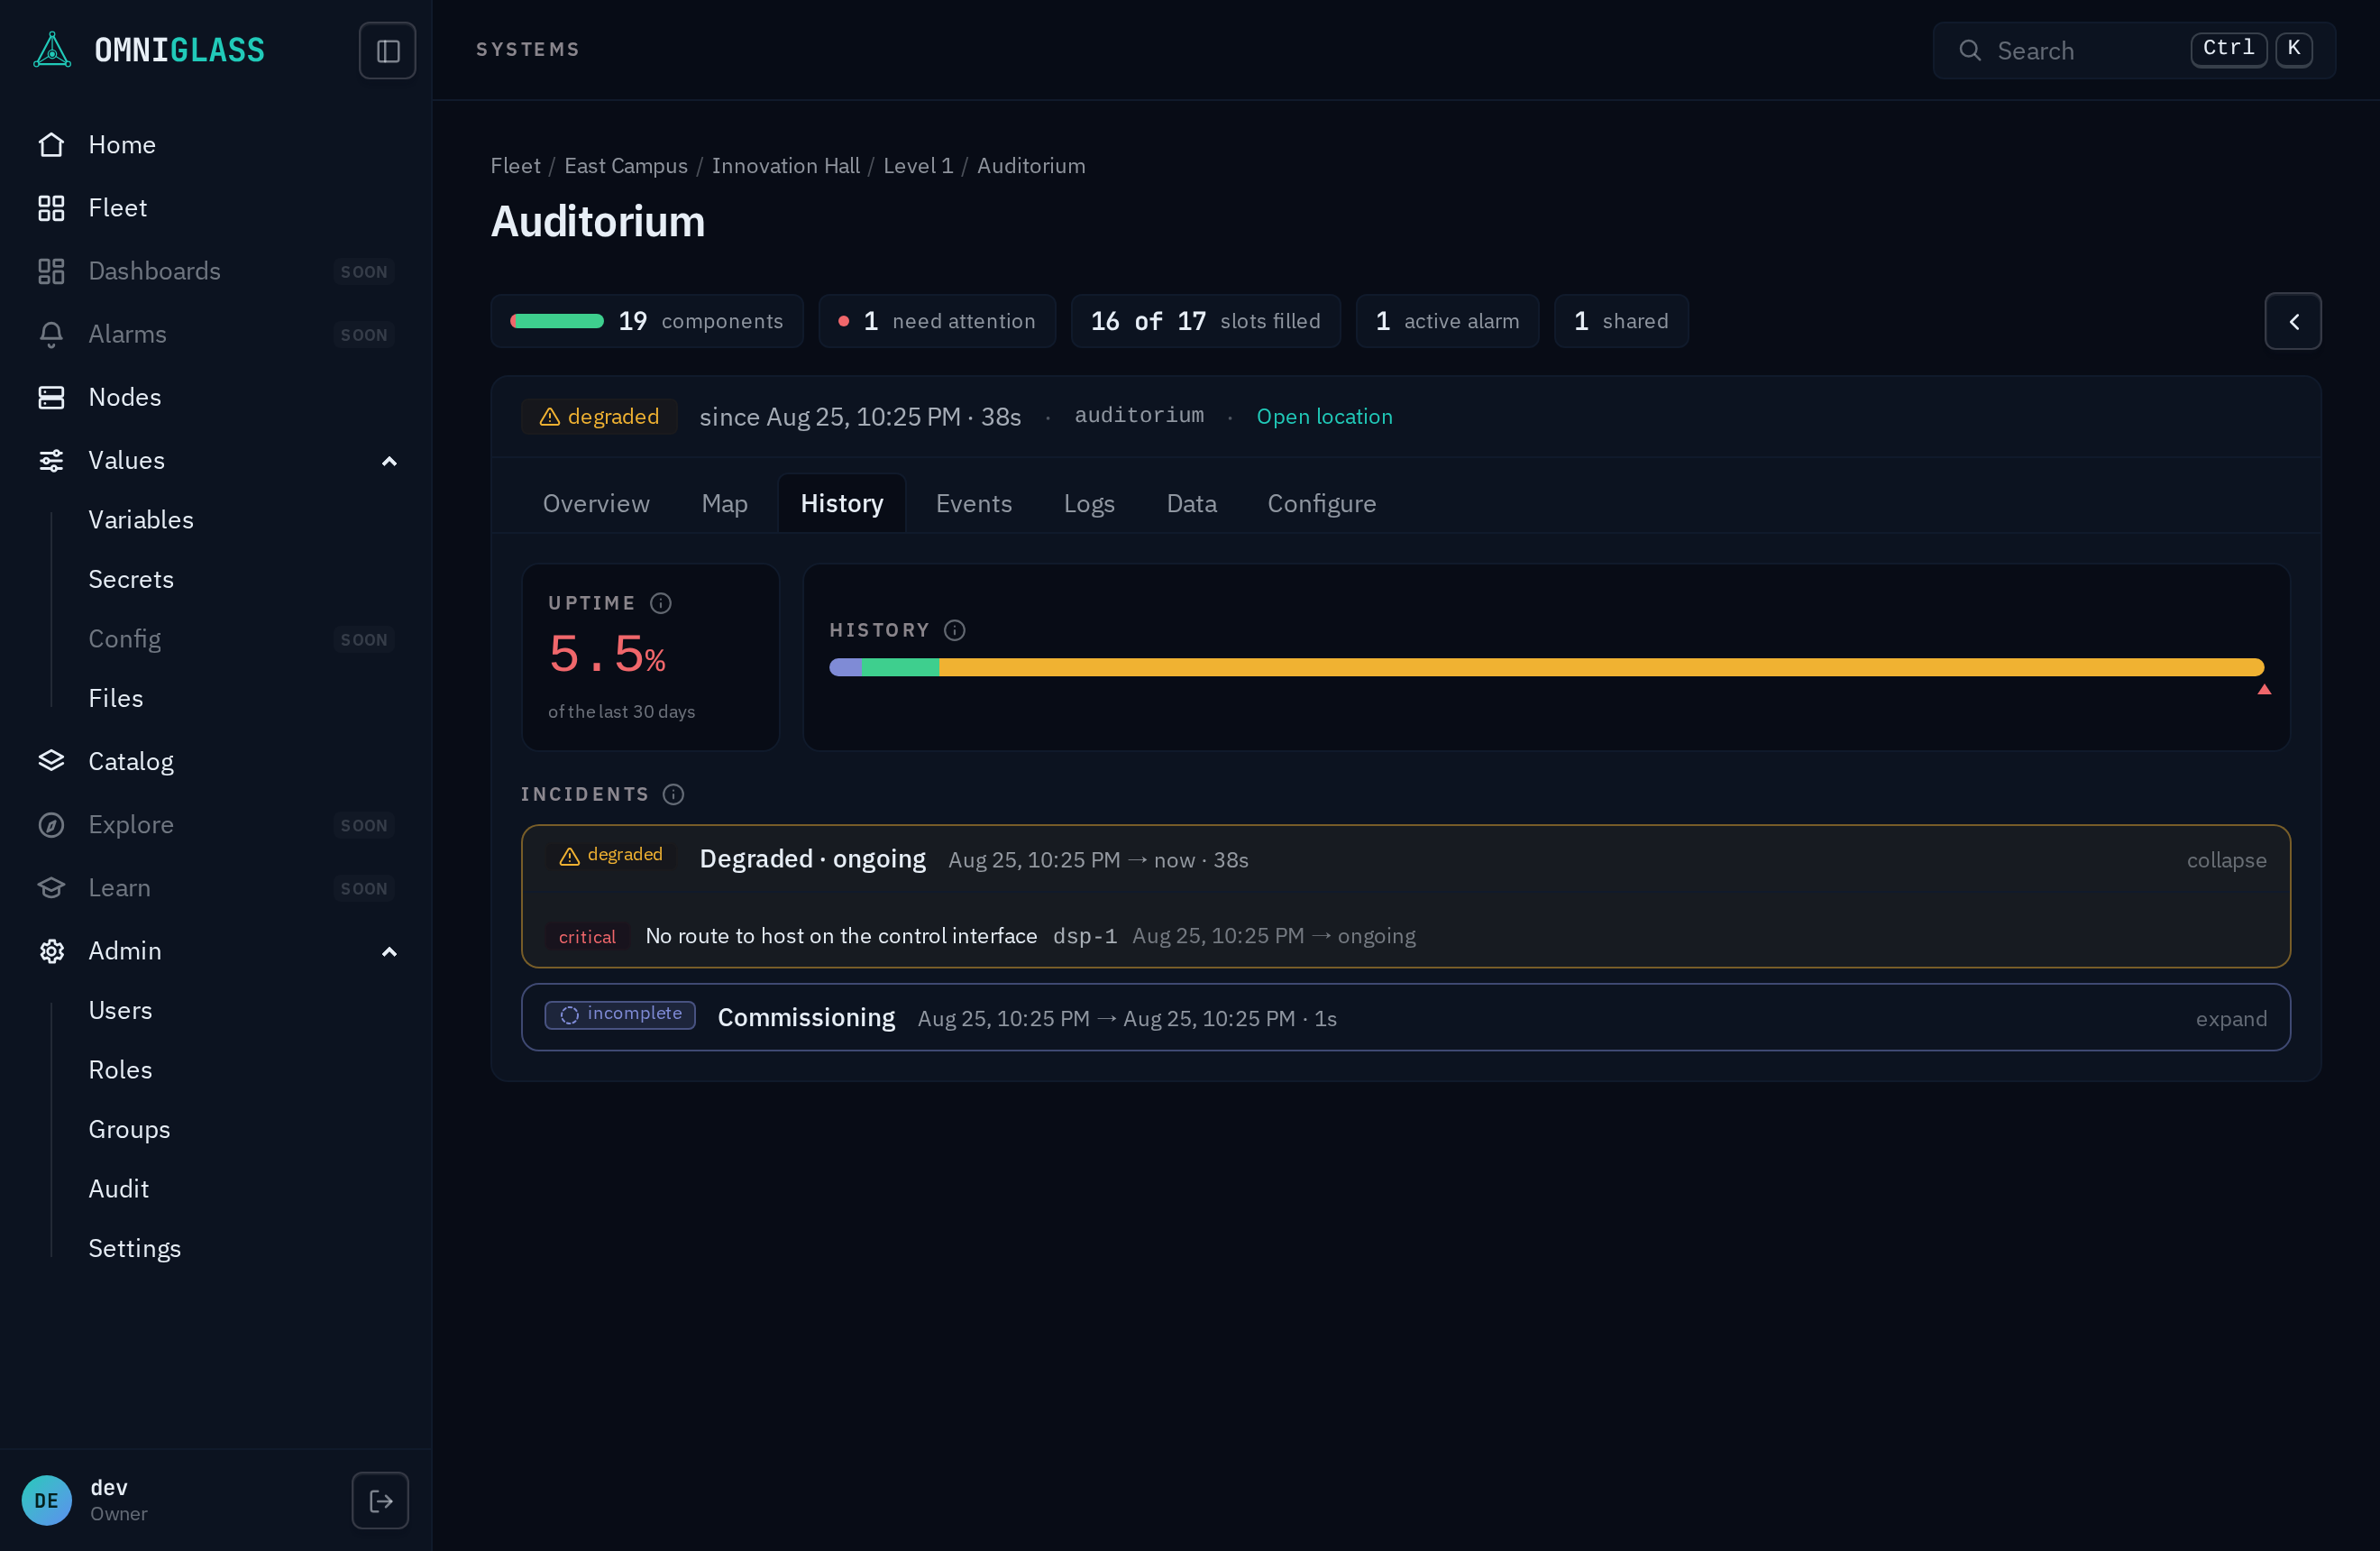
Under the incidents, the events are the system’s story on the event lane: the system’s own events and its members’, newest first, each row labeled by the owner that raised it; and the logs are the members’ raw lines merged, each naming the component that wrote it. Both cover the last 24 hours, capped; both scope to what you can read. A component’s Activity tab carries its own events the same way.
Configure
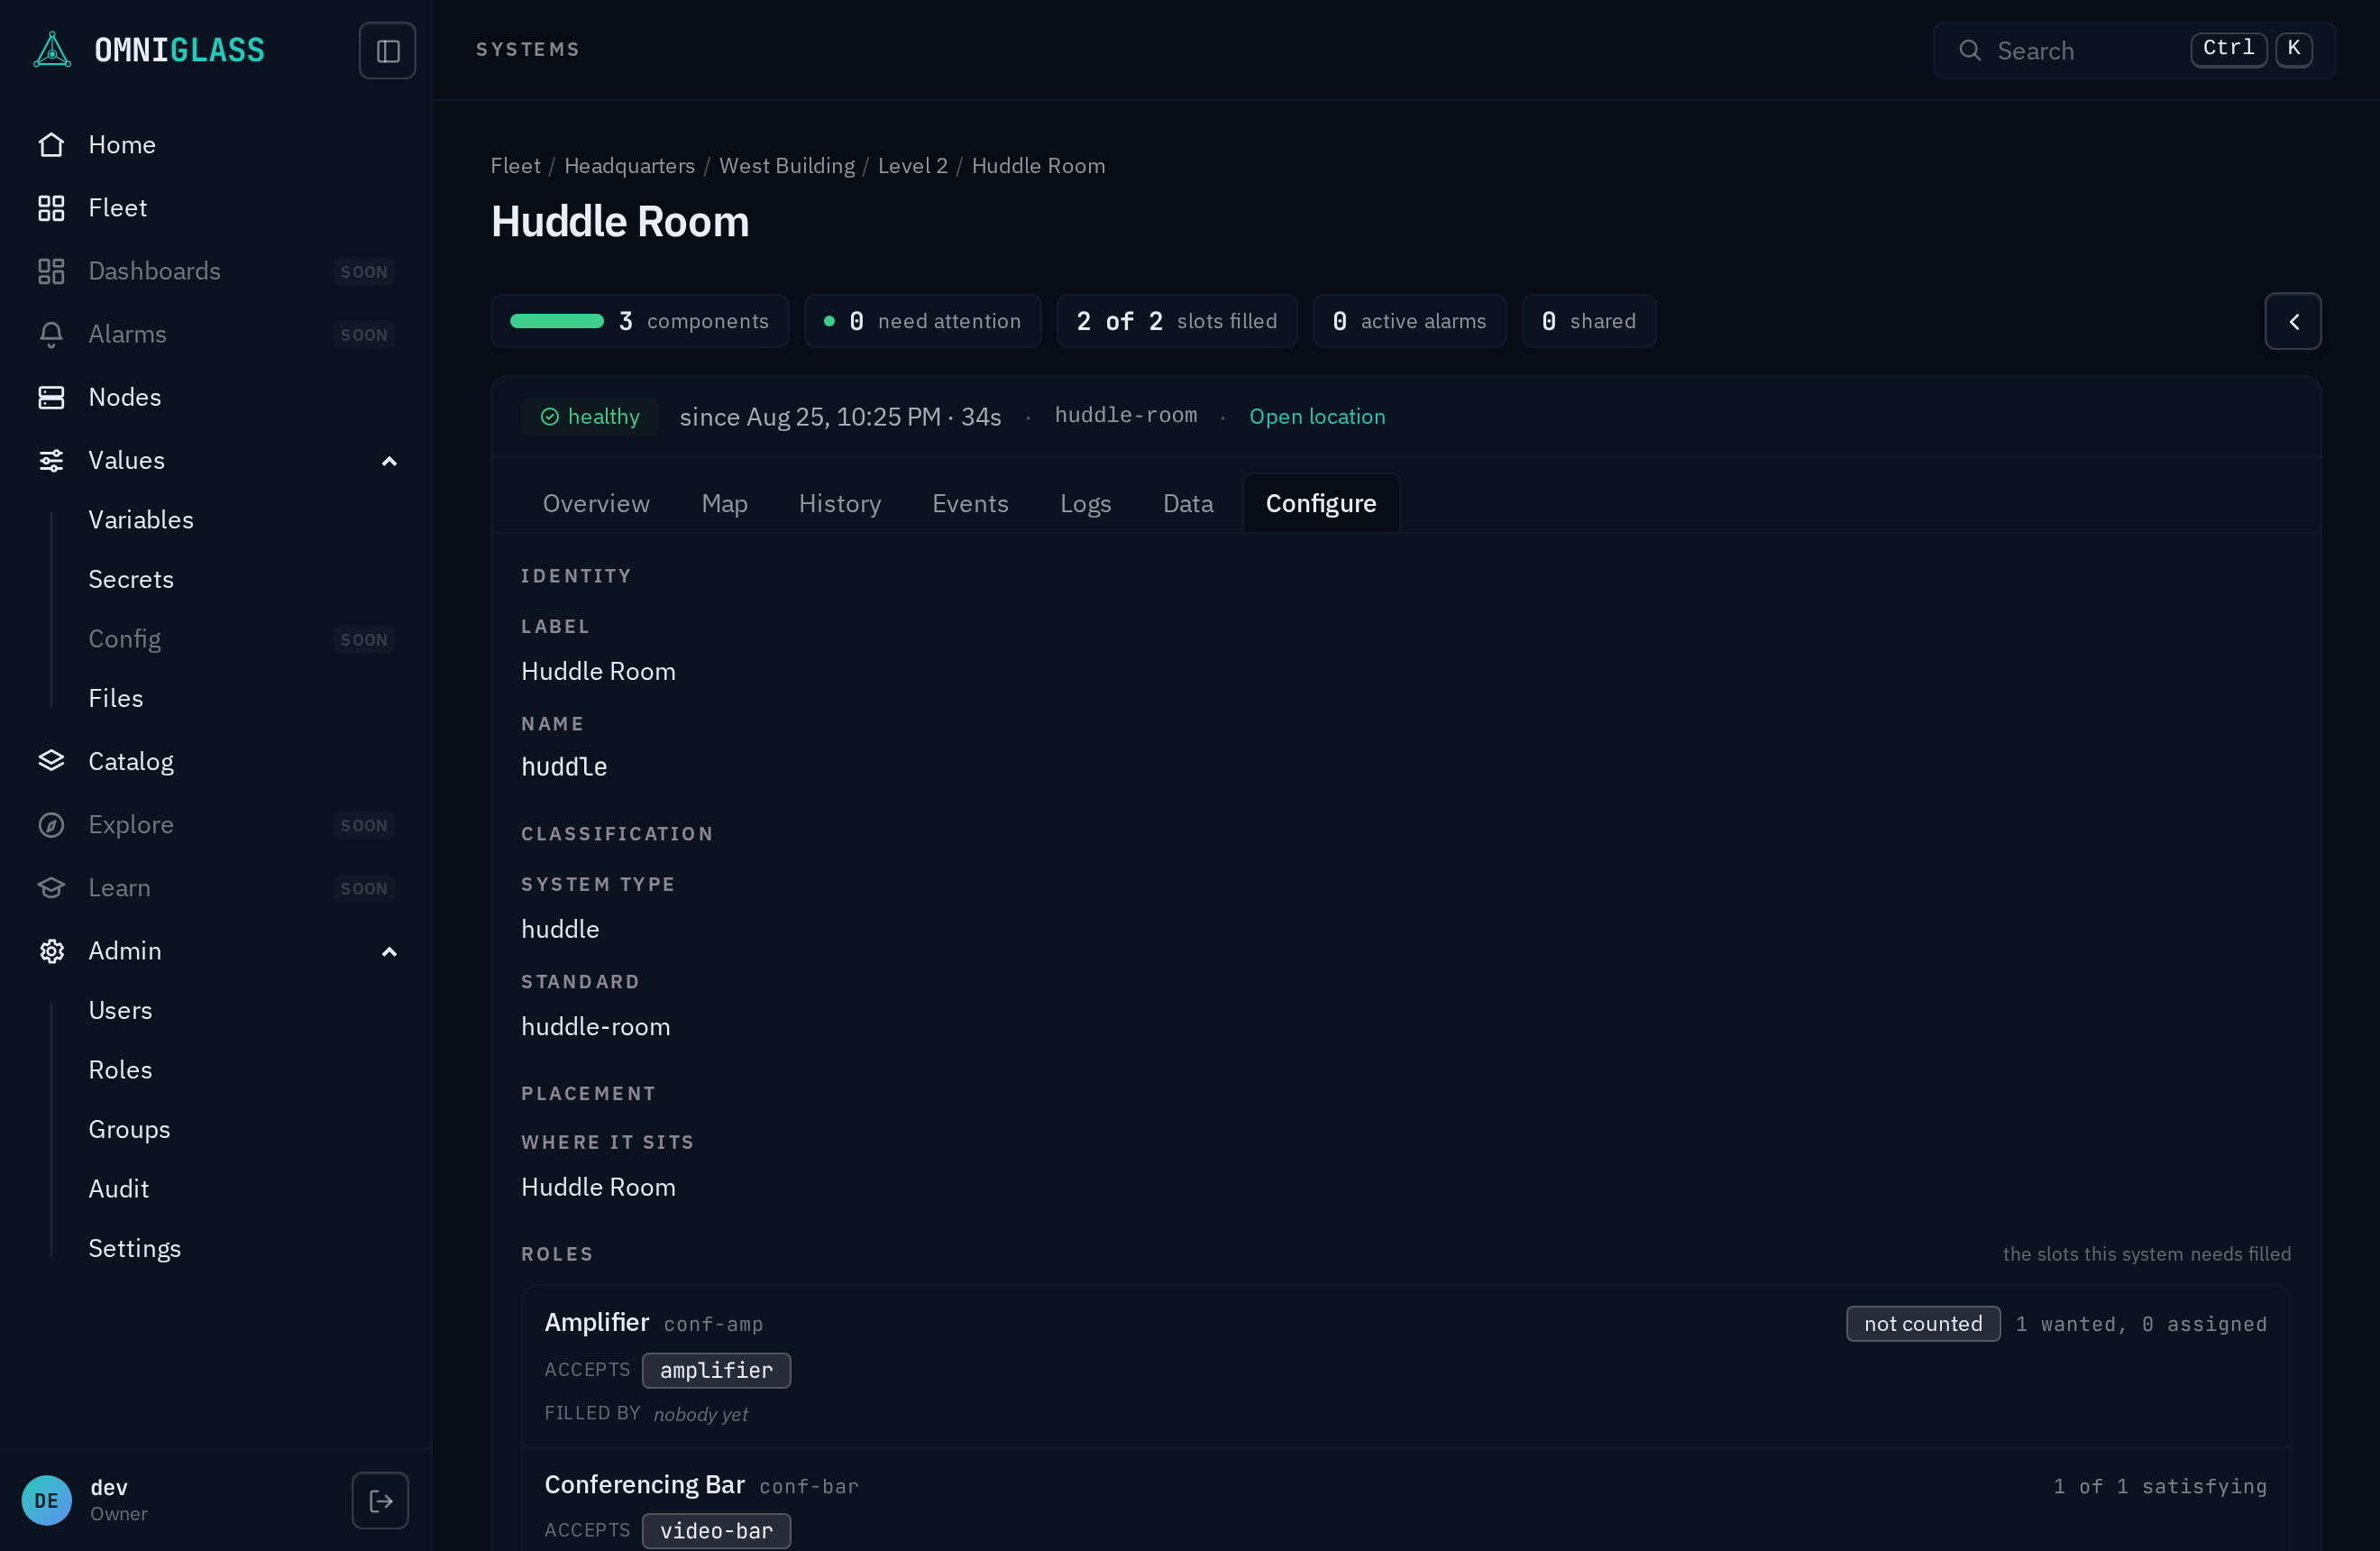
Section titled “Configure”Editing lives on the detail view (#800): the Configure tab renders for anyone holding an
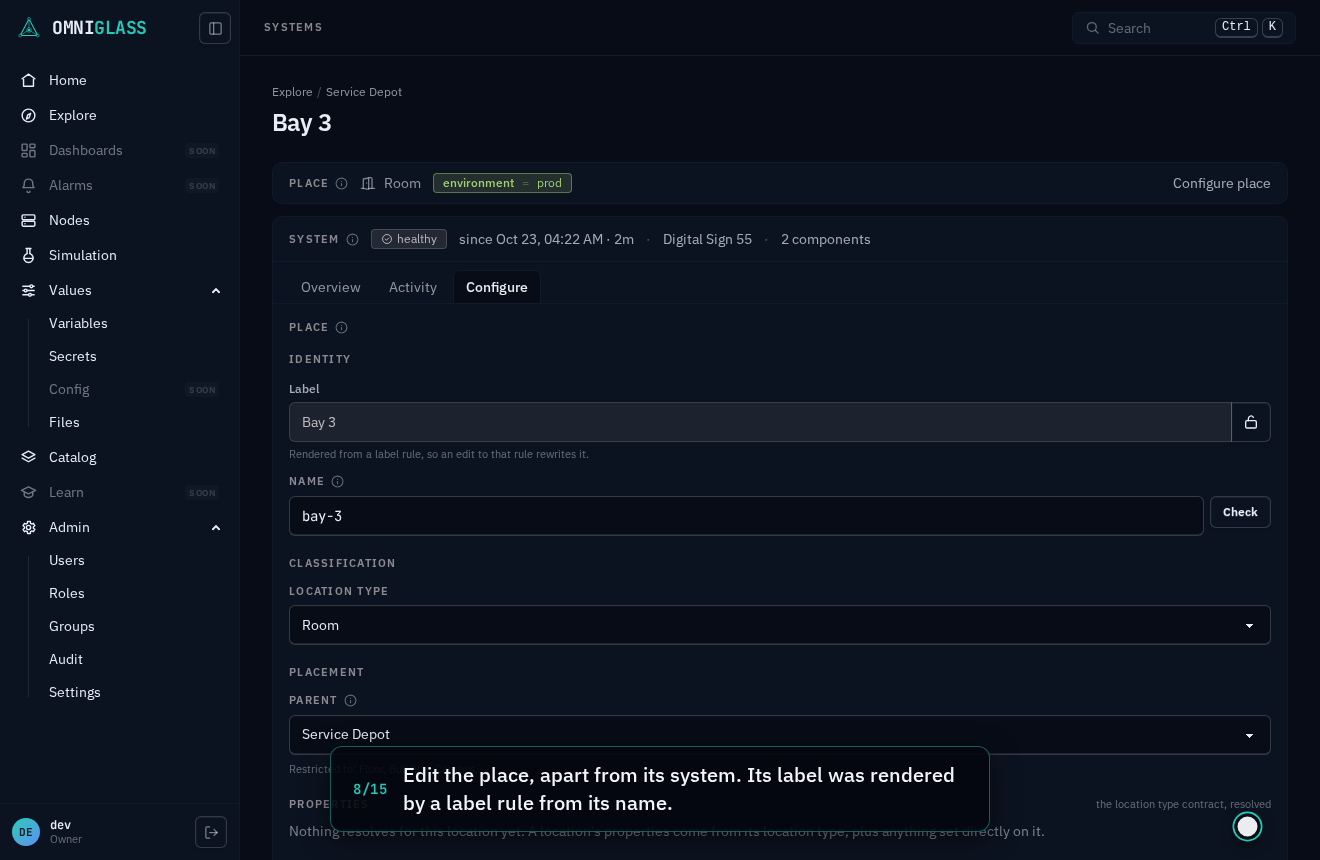
edit verb on the entity, and inside it the sections gate one by one. Identity carries
the label (with the platform’s pen) and the name with its advisory precheck; renaming
breaks bookmarks and integrations by design, so the check and the consequence line sit
beside the field. Classification is the standard and type selects (a component’s
product is fixed at creation). Placement moves a location under a new parent, its own
permission and its own audit verb; systems and components read where they sit.
Tags edit in place. One save model everywhere: Edit stages drafts, Save commits them
together (the rename last, so a refusal leaves the rest saved), Cancel reverts. A
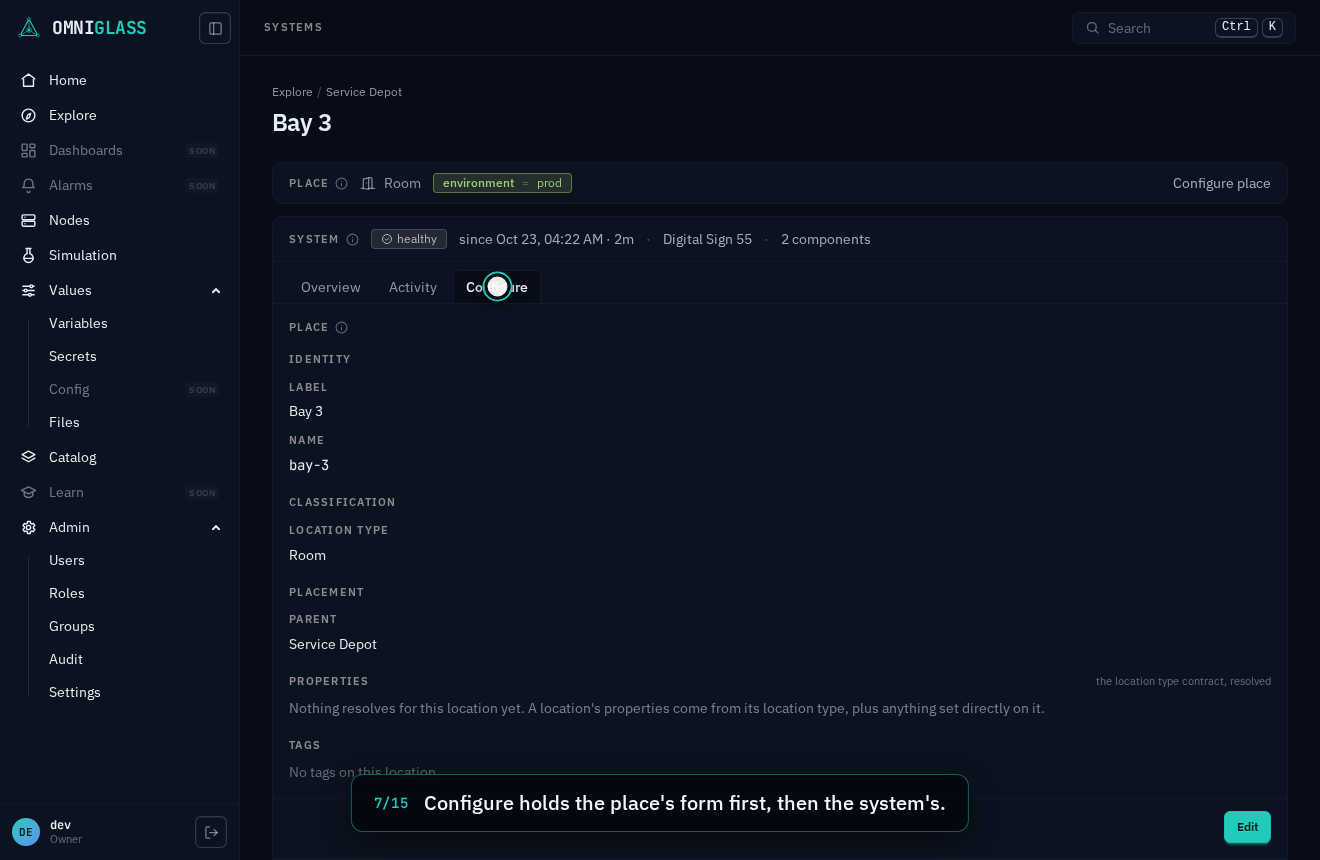
?edit=1 address lands already editing. A sole system’s Configure also carries its place’s
form, in its own section with its own Edit (?edit=place opens that one). A place’s and a
component’s views carry the same tab. The side panel carries the same form’s identity, classification and tags; roles,
properties and their cascade are configuration, and live here.
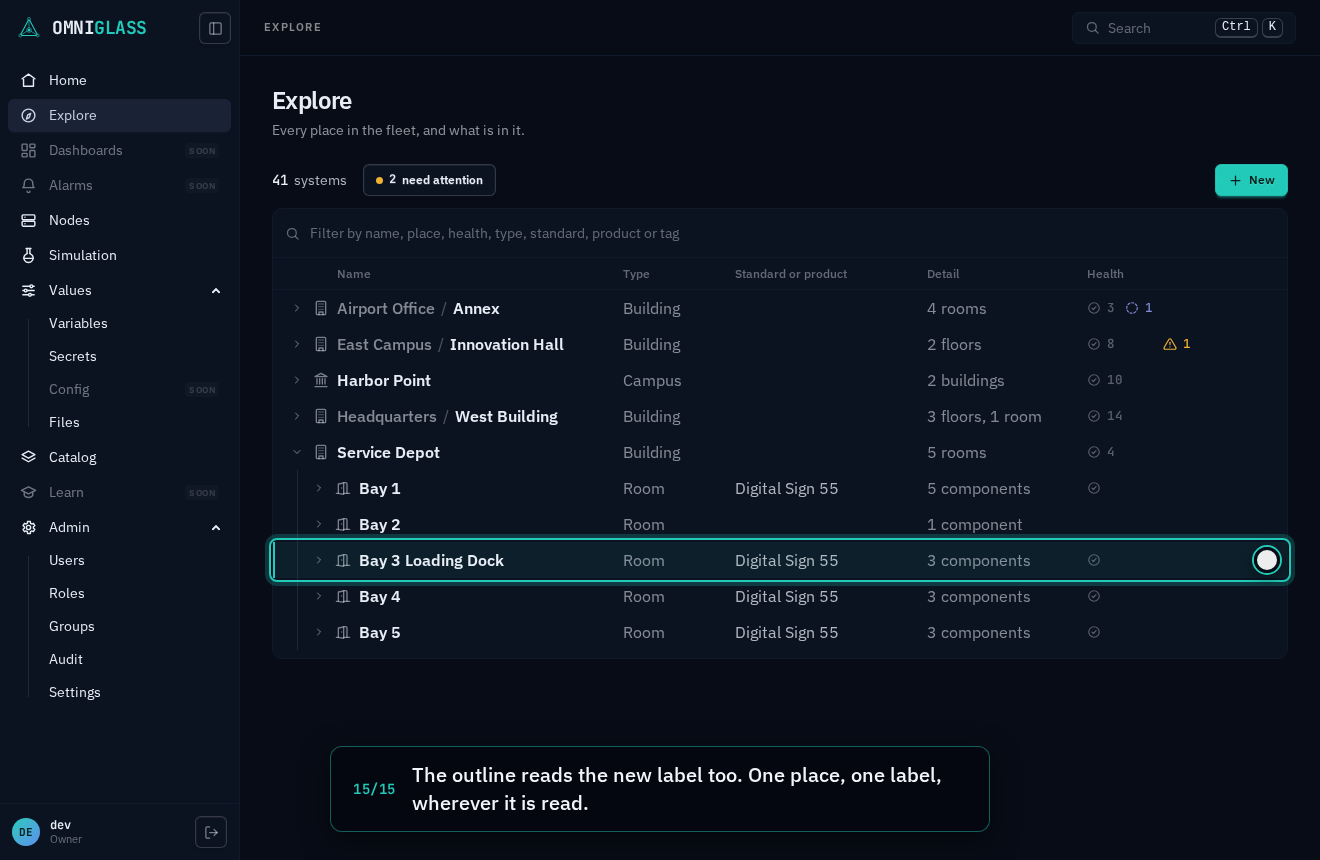
Finding a place and fixing its label runs the whole path: Explore down to the place, its system’s view, the place’s own section under Configure, and the new label read everywhere the place appears.
Every step, captioned (15 steps)
Explore is the outline of every place in the fleet, with what each one holds.
Open a building. Each place inside reads its type, and the standard its system is built to.
Bay 3 holds one system, so opening the place opens that system.
The system's panel names the place it sits in, above its own facts.
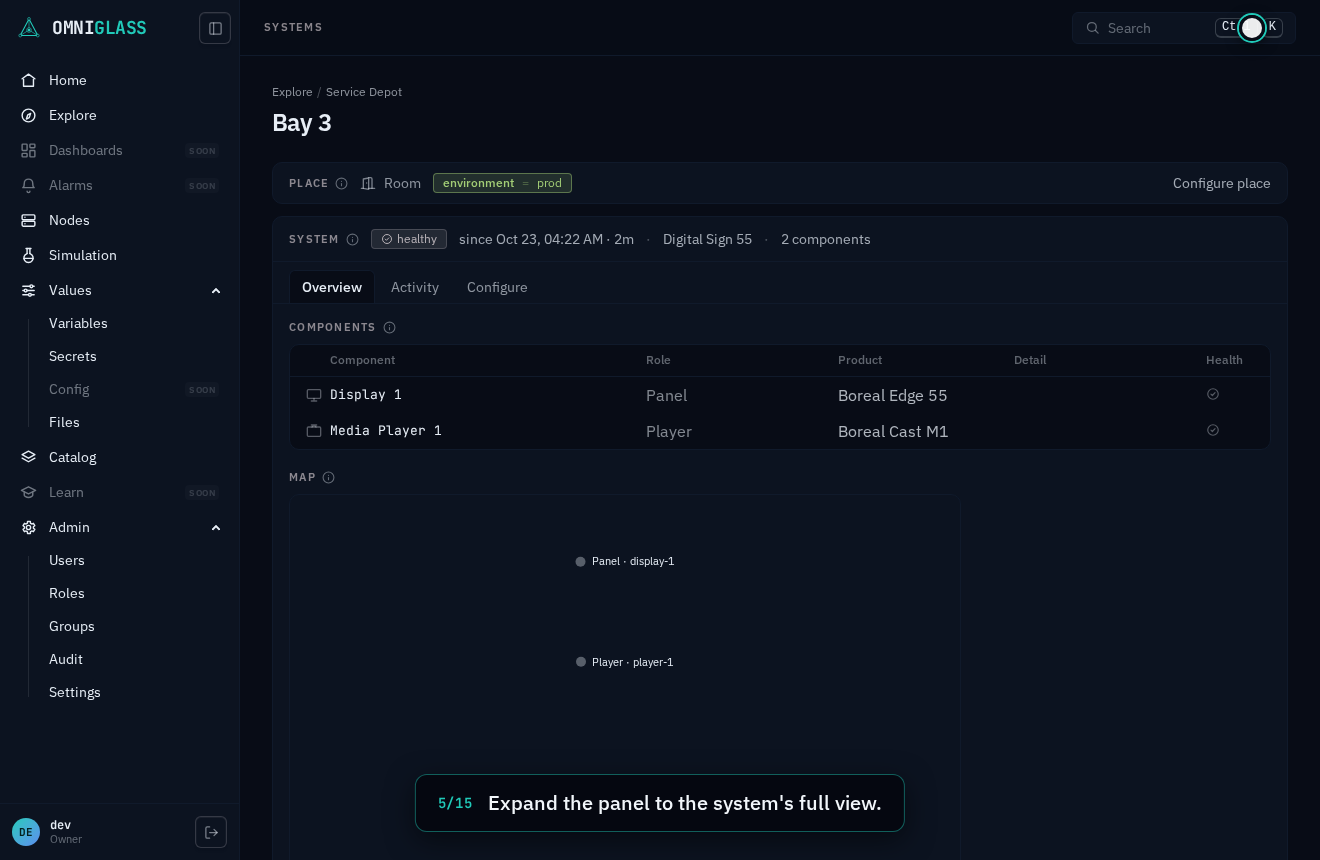
Expand the panel to the system's full view.
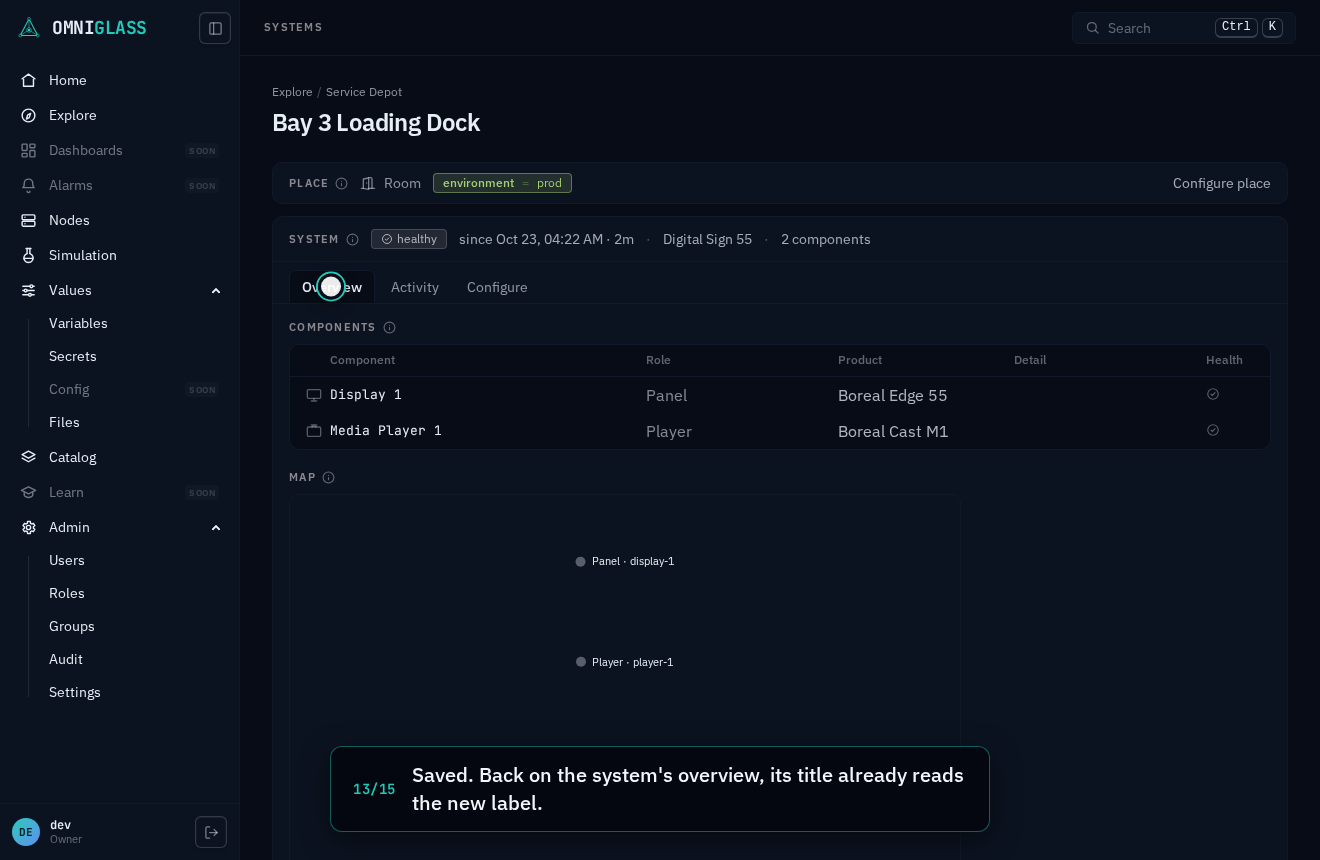
A place holding one system has no page of its own. The system's view is titled by it, with the place as a card below.
Configure holds the place's form first, then the system's.
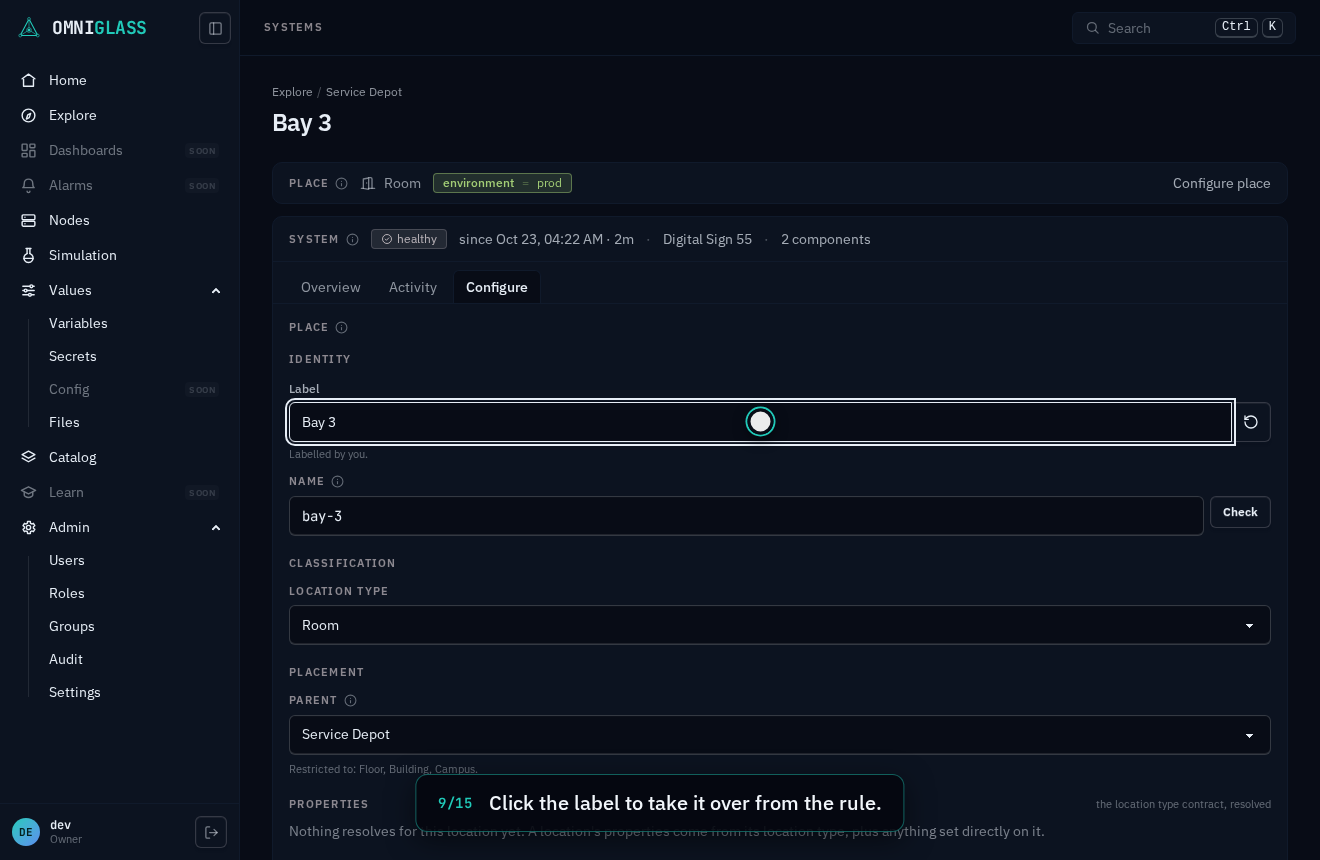
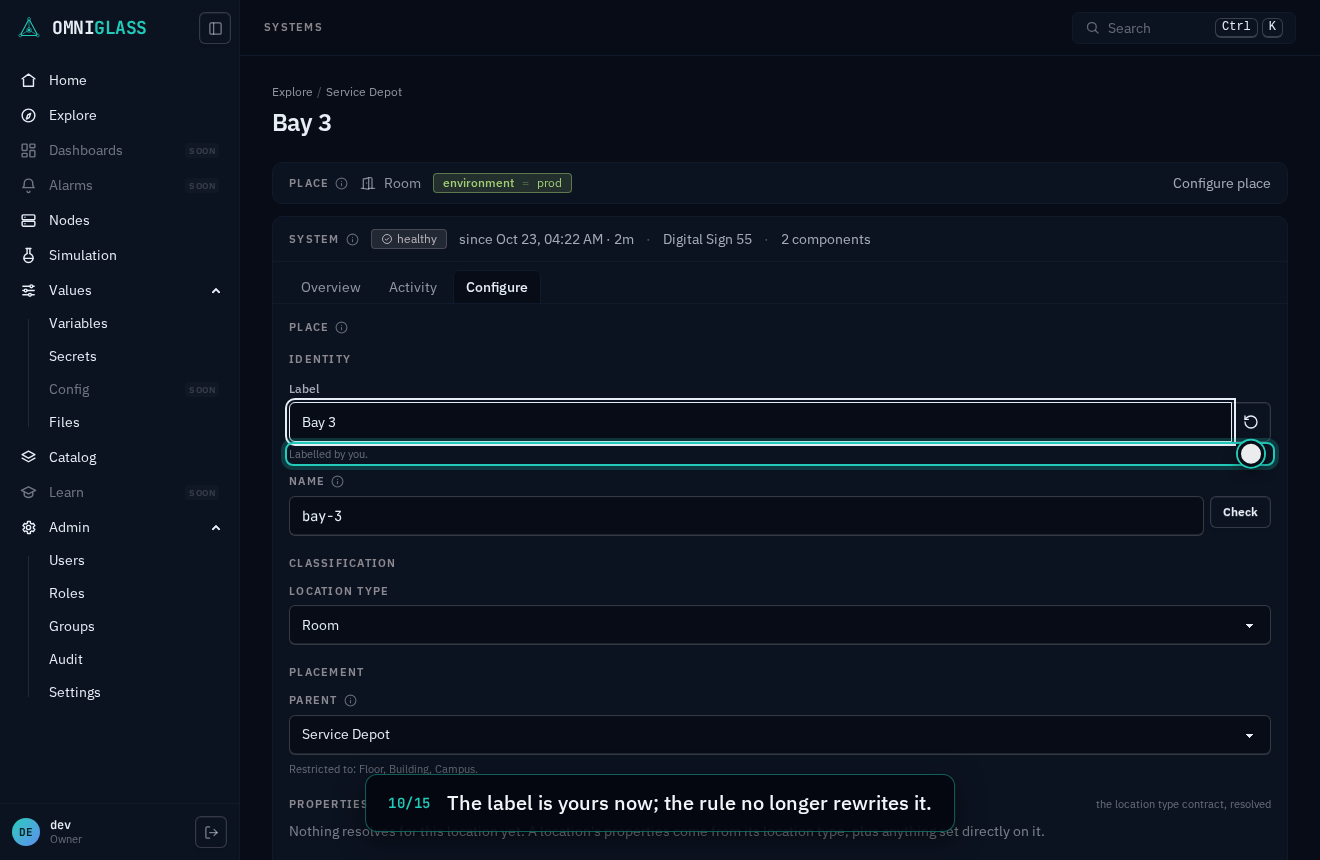
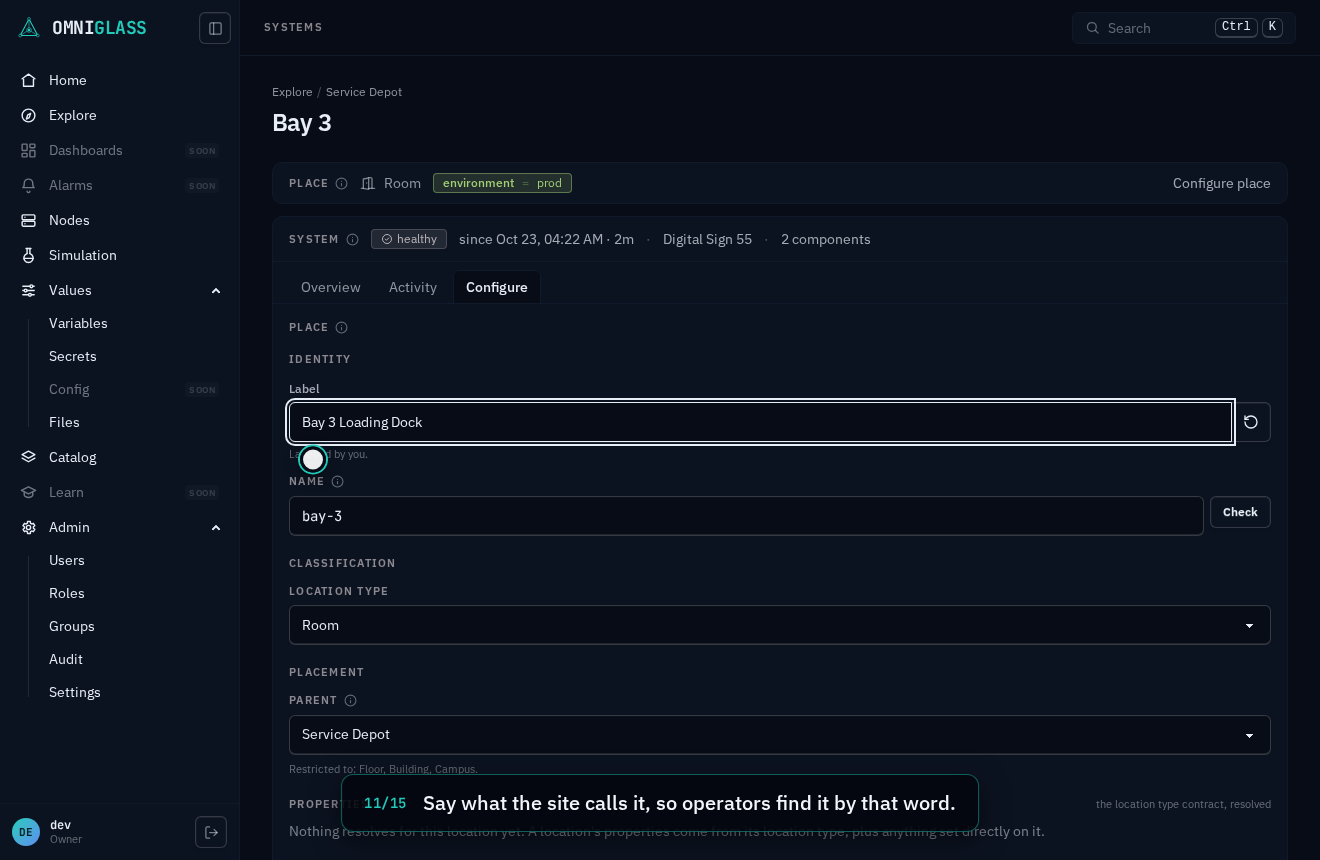
Edit the place, apart from its system. Its label was rendered by a label rule from its name.
Click the label to take it over from the rule.
The label is yours now; the rule no longer rewrites it.
Say what the site calls it, so operators find it by that word.
Save the place.
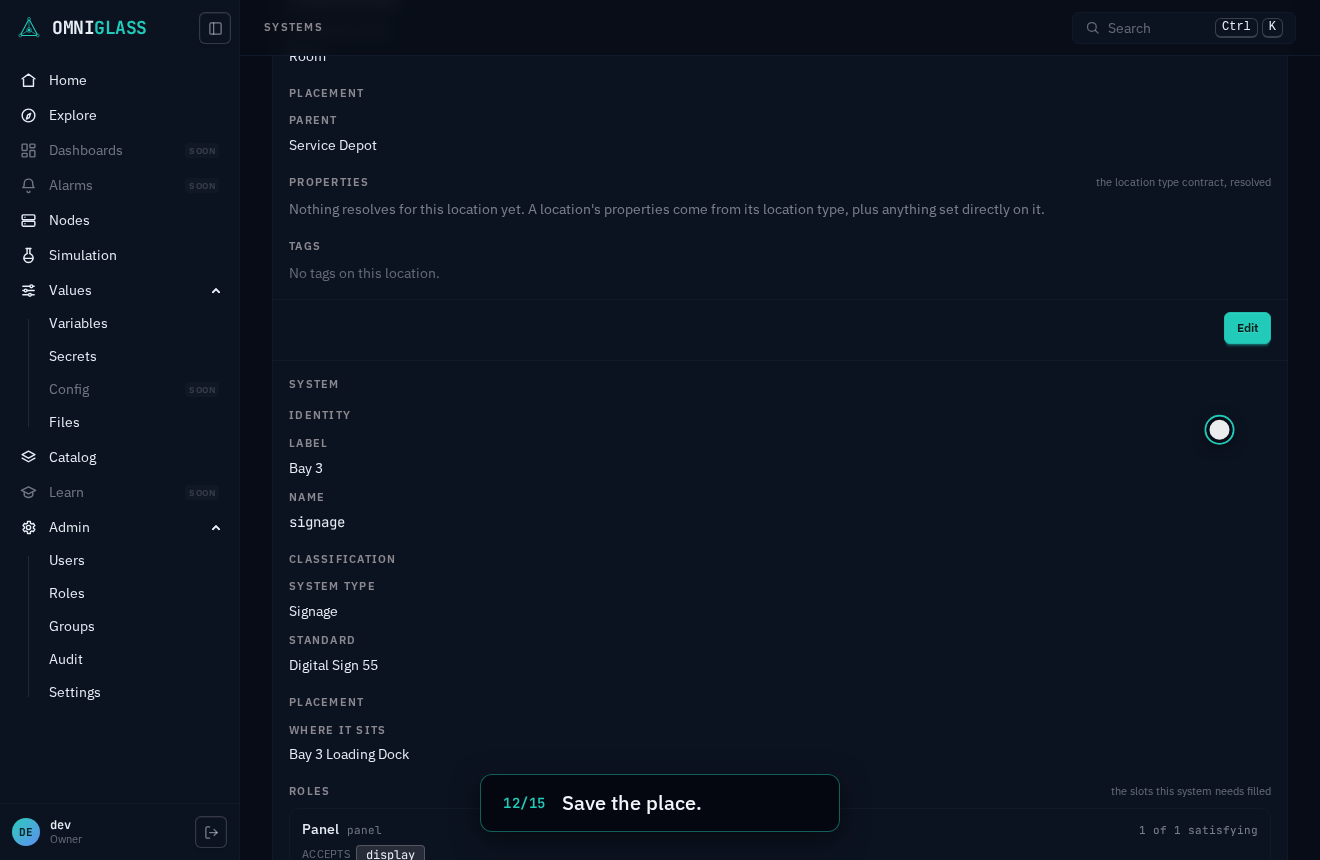
Saved. Back on the system's overview, its title already reads the new label.
Back to Explore, opened down to the place you were on.
The outline reads the new label too. One place, one label, wherever it is read.
A component
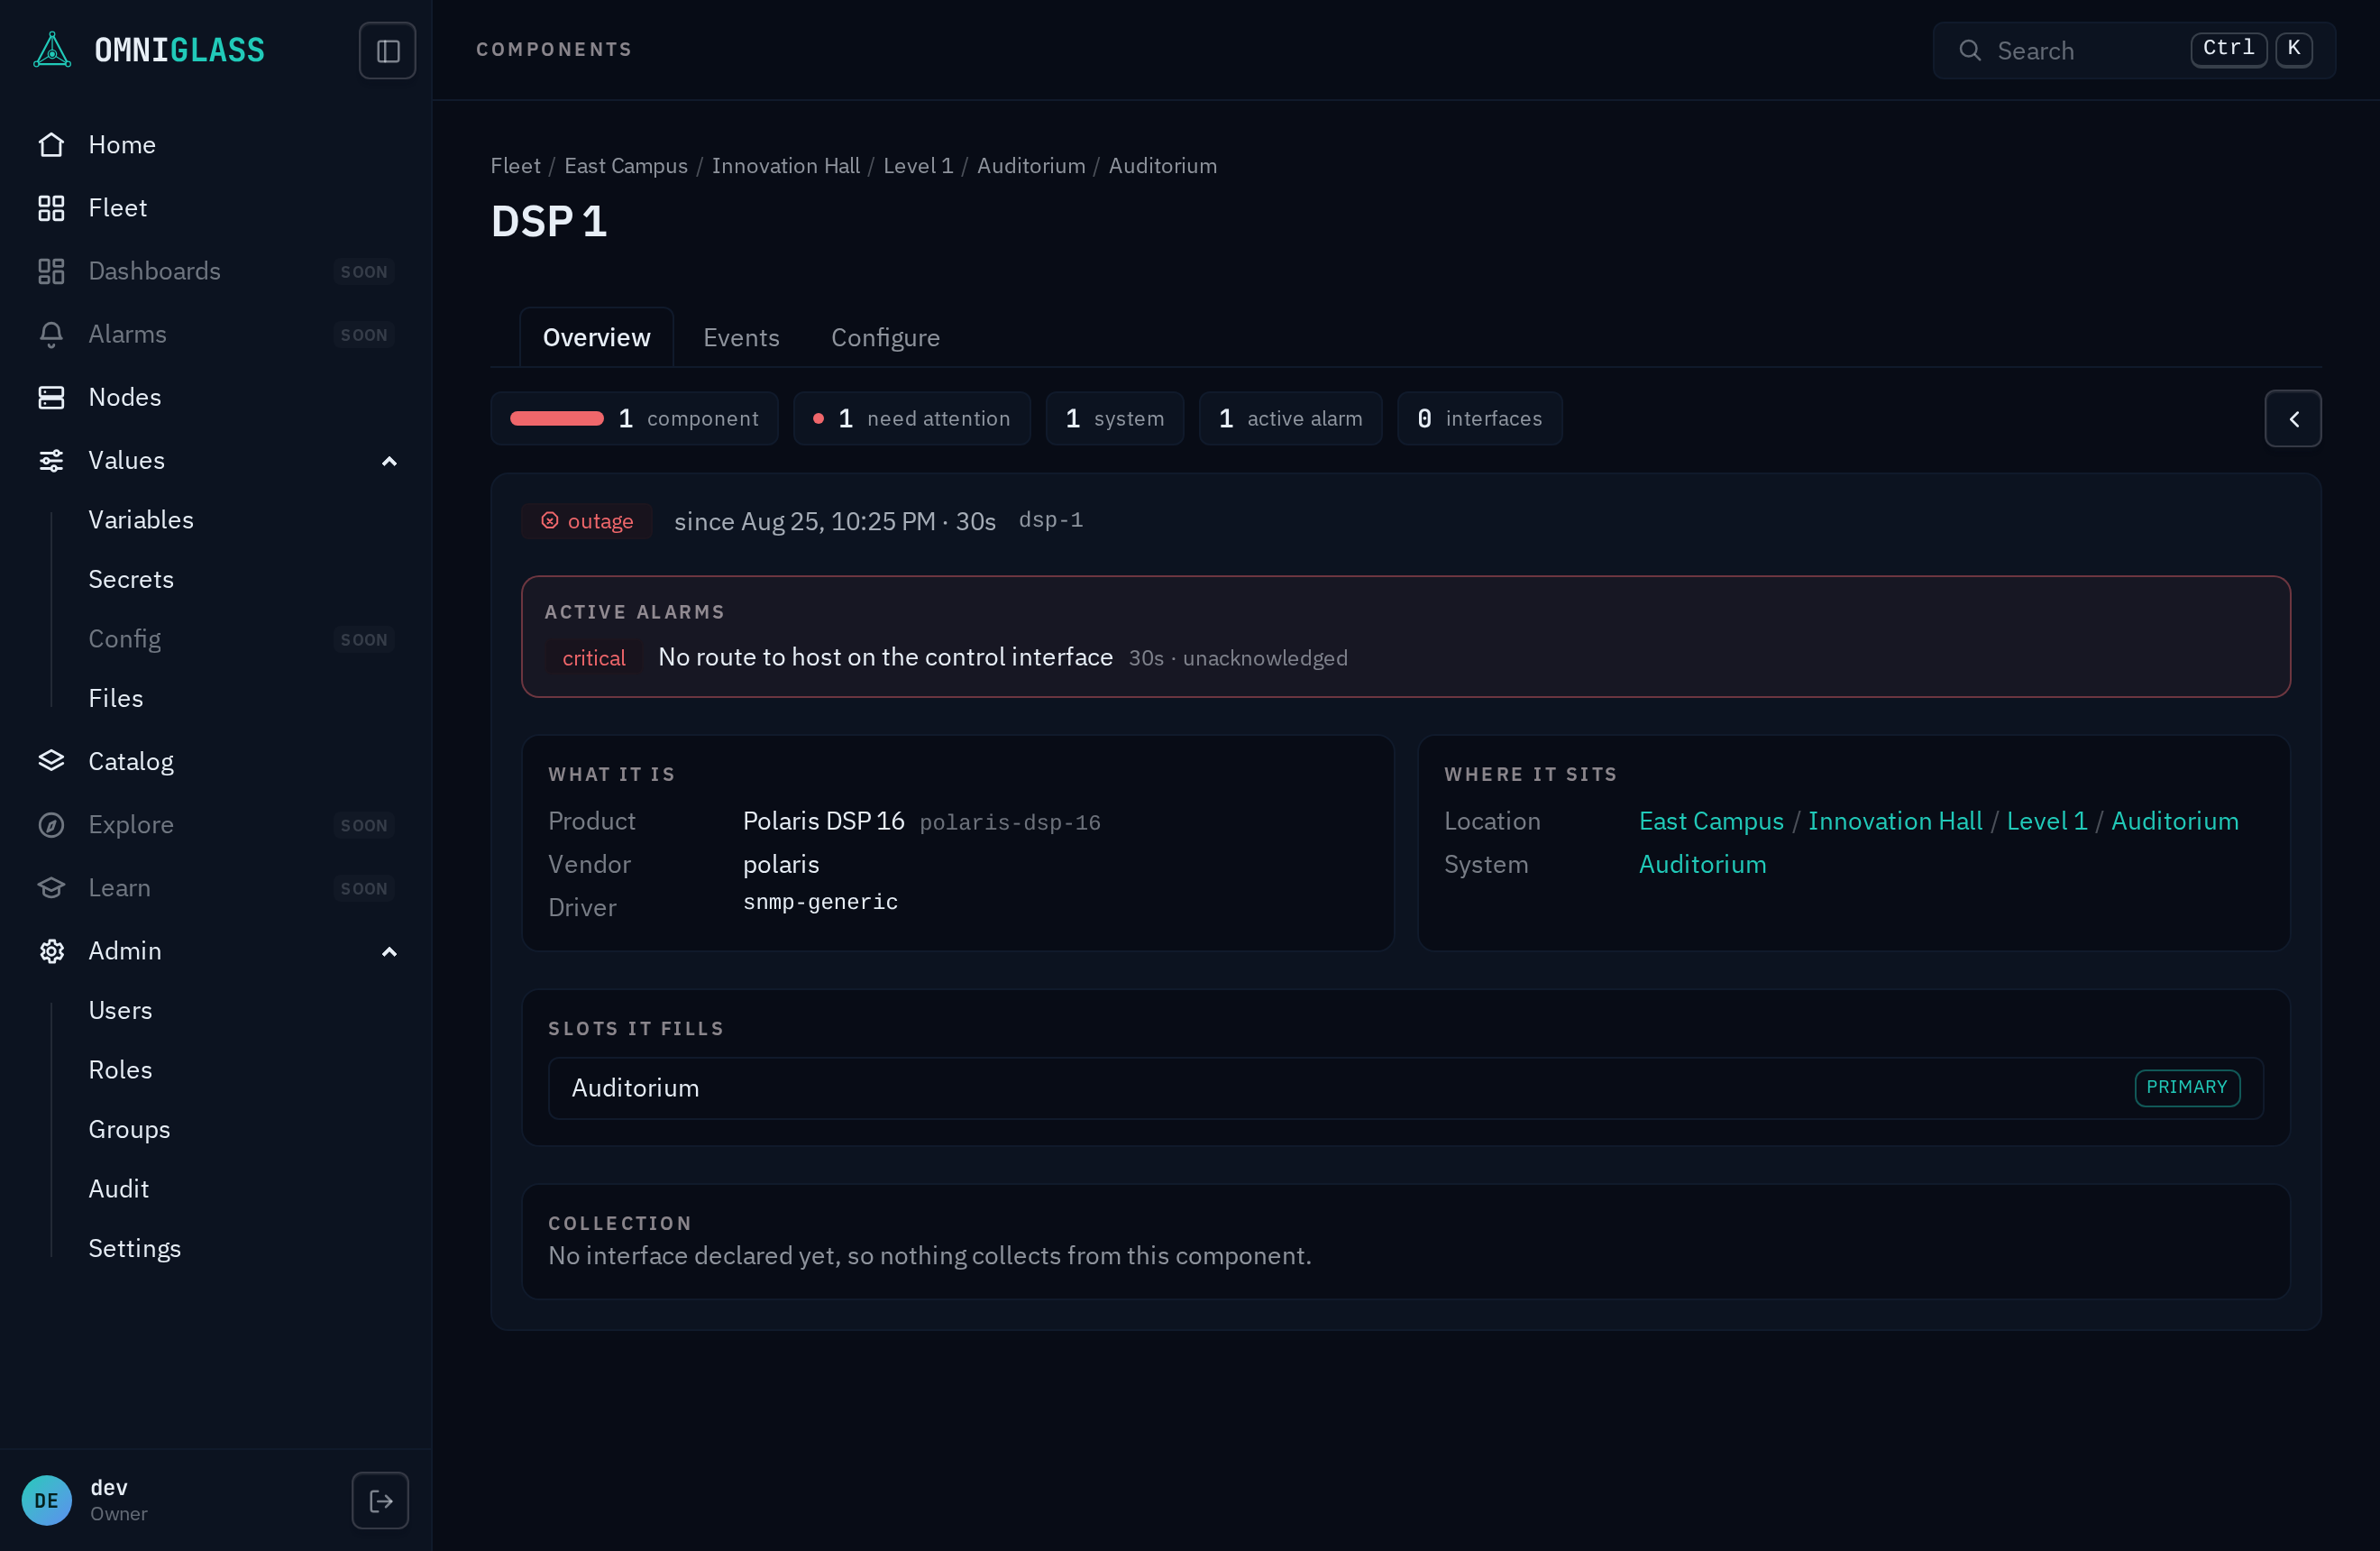
Section titled “A component”A component is a piece of a system, so its view opens with its place card too, saying whether the place is the component’s own (set here) or its system’s standing in for one it does not have (from its system). Then the component card: the verdict and since when (a component has no recorded edges, so since-when is what took it down: the worst active alarm and its age), its product, and its tabs.
Overview reads why (severity, message, age, and whether anyone has acknowledged it; a cleared alarm is history, not a state), what it is (product, vendor, driver, and every property the contract resolved to a value: model, serial, firmware, the RMA facts), and the systems it serves, each with the role it fills there and the primary marked when there is more than one. Vitals lists the effective metrics that carry a value, a dot marking the component speaking rather than a contract default standing in. Each section’s explainer is on its label’s tooltip.
Collection shows each endpoint with its reachability ladder (the ping answers the path, the transport answers the service, the login answers the credential; each rung teaches itself on hover), a held session’s state where the endpoint holds one, with why and Retry when it was rejected, and both keys with Trust this key when what changed was the component’s host key (held sessions), the node, its state, and when it was last seen: when the server last received anything the endpoint’s task delivered, not its last up/down change (hours old on an endpoint that never stopped answering) and not a time the node wrote on a sample. Every endpoint whose transport can probe has a reachability verdict, a driver’s included: an SNMP endpoint’s is its standard get answered, and a udp endpoint’s its driver’s request answered (a bare udp or snmp endpoint has nothing to send, so it needs a driver). A stale sample under a healthy node points at the component or the network path, not at collection. An offline node says nothing about the component. This card is the one place a node appears on these pages.
The component’s view refreshes on its own while it is open: its Collection, Vitals, and its alarms with the verdict they make every 5 seconds, the node behind Collection every 10, so an endpoint you just added, or a component going down, shows up without a reload. It reads only this component and its node, never the whole fleet, and stops while the browser tab is hidden.
The page shows only what you can read. Without system read access you see the location tree with no contents; with no fleet access at all you see an empty page, not an error. An out-of-scope root is absent.